What I mean by this title is that once buyers (or sellers) have become committed to a move in a stock, there tends to be a general “bandwagon effect” as more and more people believe in a general change in trend, either to the long or short side. Let the big guys with much more money than you and me do the heavy lifting. Again, look at the title of this post. This trend following approach is in contrast to a mean reversion system, which rarely waits for the confirmation. Although both systems have their merits and can be equally successful, I am only talking about trend following systems in particular in this post. However, bottom picking (or top picking in the case of shorts), is different. Bottom pickers (or top pickers) are anticipatory trend followers. For whatever reason, it seems that bottom picking is such a sought after approach despite its statistically flawed methodology. The better thing to do is to wait for the trend to have a change in an explicit fashion (as per your own definition and timeframe). Now, you clearly don’t want to be the last person to the party, but you just as equally shouldn’t aspire to be the first person. Be fashionably late. The important part now is to develop a system and set of rules to identify when a change in the trend has occurred in your trading timeframe.
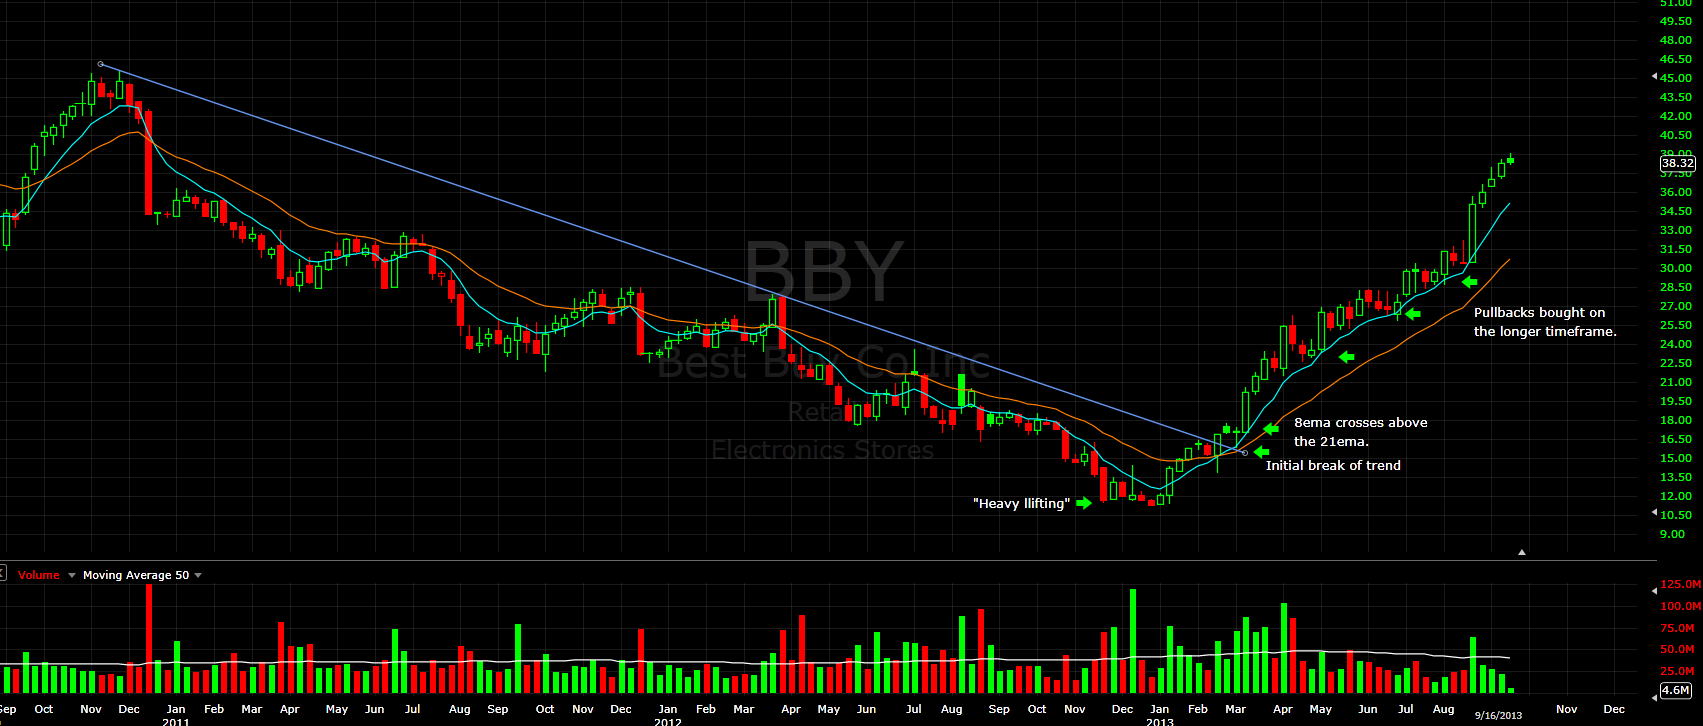
I don’t want to just talk hypothetical fluff. Here are some examples I try to use in order to determine if there has been a longer-term change in the trend of a stock. One way I try to determine if there has been a longer-term change in trend is by looking at the initial break. As a way to help me confirm that break of the previous trend, I plot an 8ema and a 21ema on my charts (you can use whatever moving average you’d like; these are just the ones I use). In the case of a change to the long side, I’ll wait to see the shorter duration moving average, the 8ema, to cross above the longer duration moving average 21ema. Below is a weekly chart of BBY showing the initial break in its downtrend followed by the 8ema crossing above the 21ema.
Weekly chart of BBY has been in a clear uptrend for some time now (as of 9/16/13):
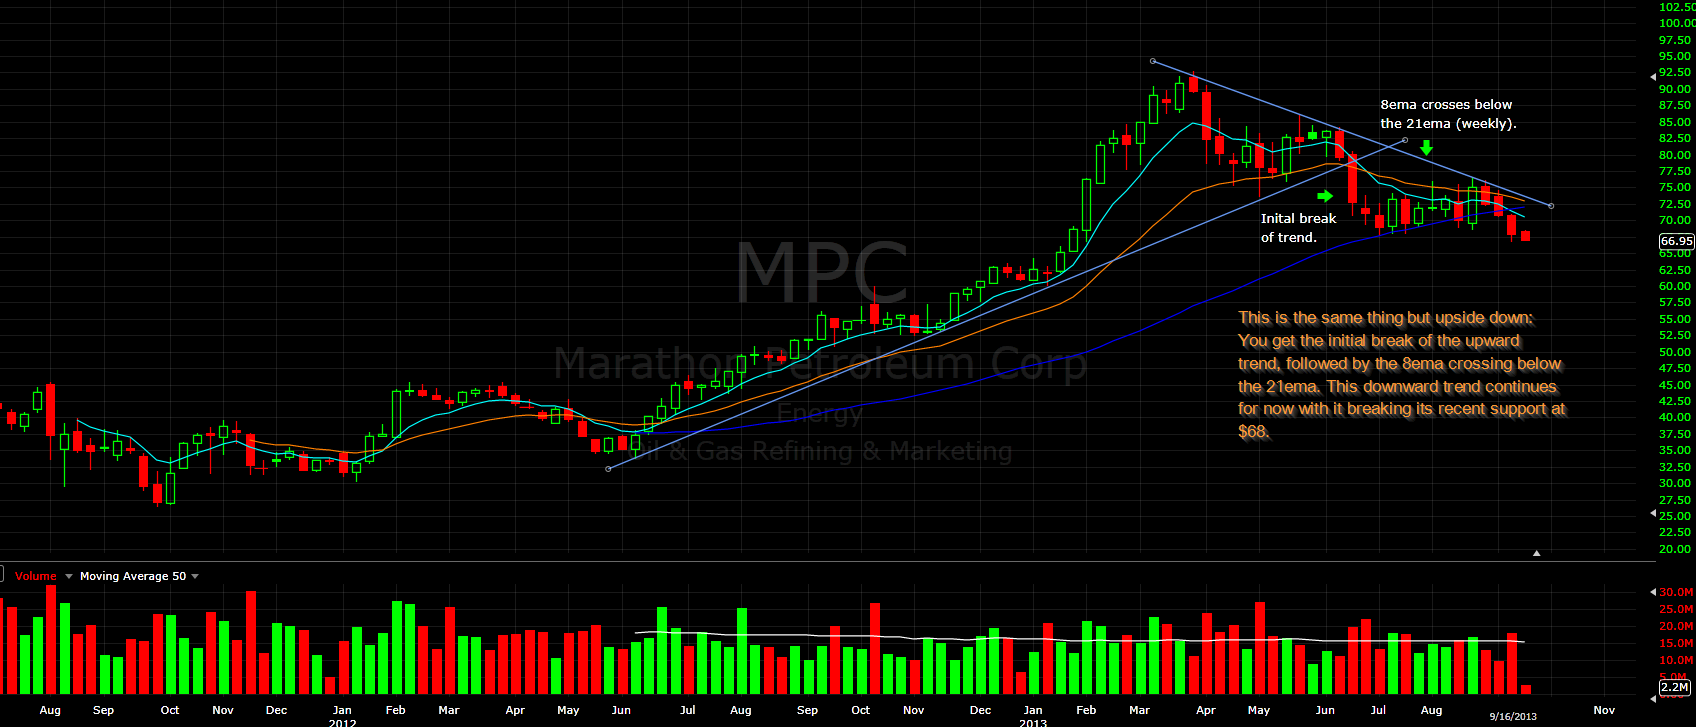
This trend following strategy can be applied on the short side as well, although less commonly in a bull market like we are in now. It is the same idea, but the chart is essentially flipped upside down. I wait for the initial break of the uptrend, and I confirm that change in the trend when the 8ema crosses below the 21 ema. Below is an example of a change in the trend on the short side in MPC.
Weekly chart of MPC showing the change in the trend to the downside:
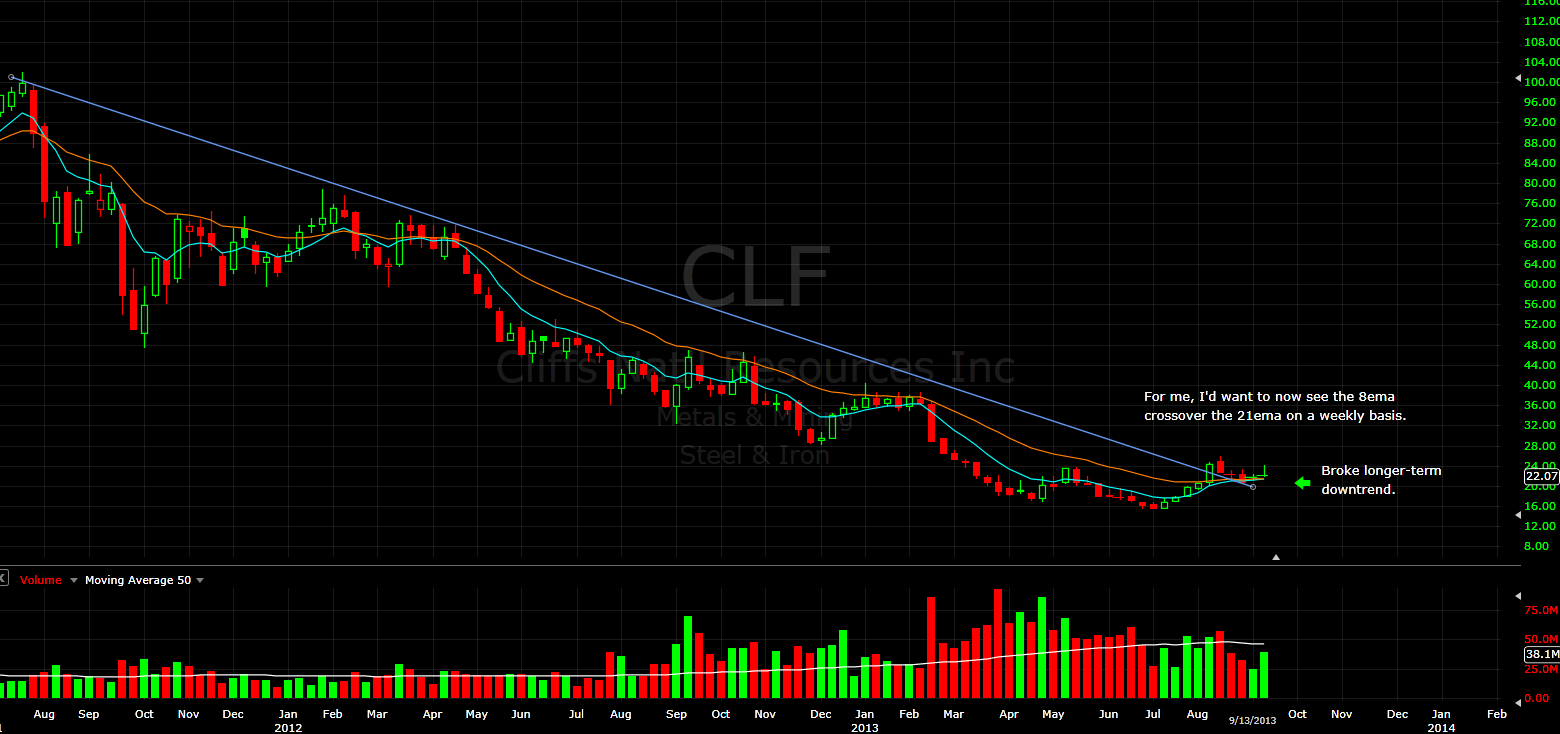
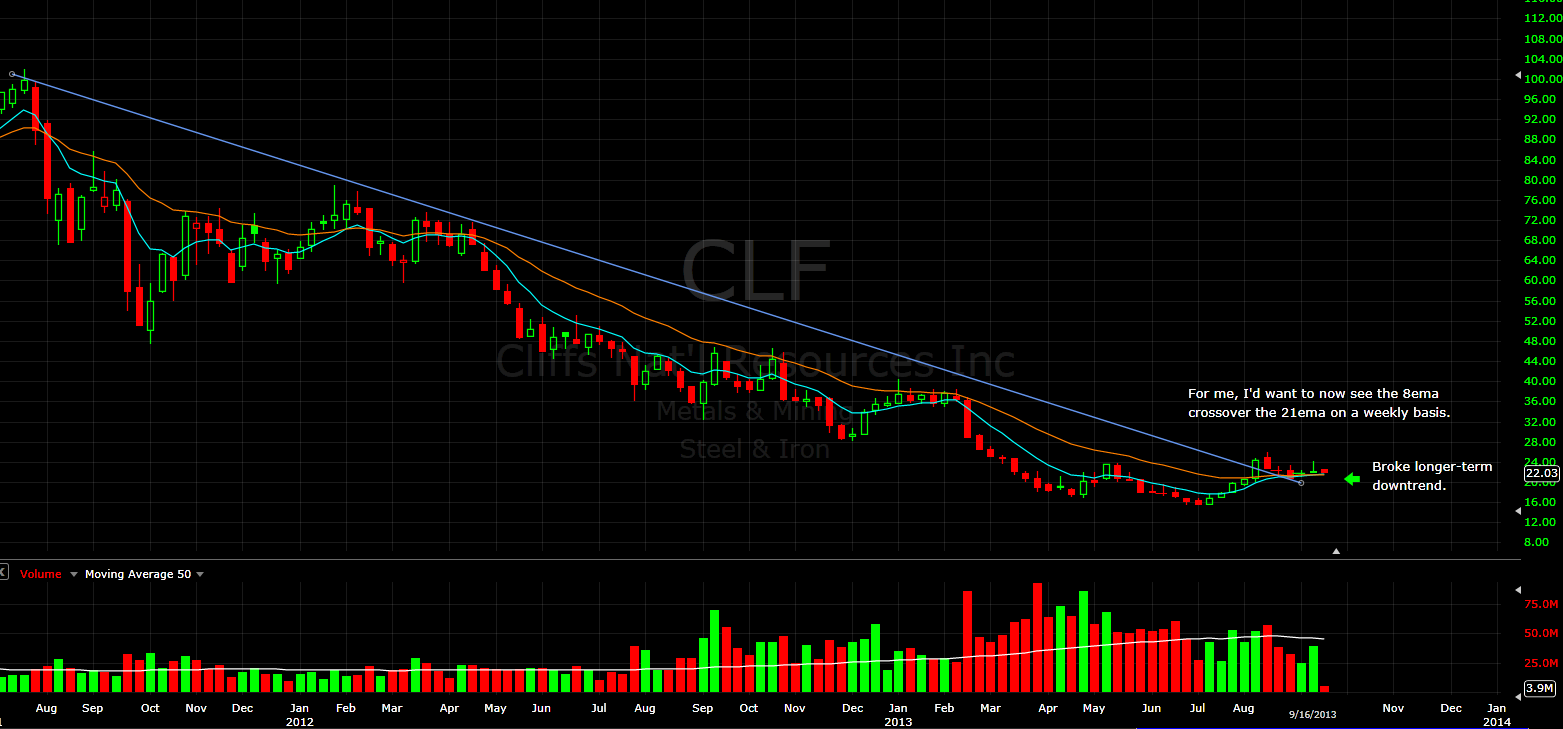
Finally, below is a chart of CLF which I am stalking on the long side. It has yet to confirm for me a weekly change in trend via a weekly close with the 8ema above the 21ema. If/when that happens, I will have received the necessary confirmation for my process. Just note this still has the potential to fail and continue its downward trend since I have yet to receive the confirmation that I need for a long entry.
Weekly chart of CLF showing a potential change in trend to the long side:
Let me know if you have any questions or comments (@MarketPicker on StockTwits).
No relevant positions.


One Comment on “Try Not To Do The Heavy Lifting in Trading”
” Now, you clearly don’t want to be the last person to the party, but you just as equally shouldn’t aspire to be the first person. Be fashionably late.” love that phrase…brilliant.
Excellent post. Perhaps you could extend your intelligent analogy to the fact that the definition of “fashionably late” depends a lot on the type of party/stock…