Despite the fact that the fast majority of those hired by hedge funds and banks these days are literally rocket scientists (PHD’s in Physics, AstroPhysics, Mathematics etc.) trading is NOT rocket science. Of course being good at math and being able to write algorithms doesn’t prevent someone from successful market speculation it just isn’t a prerequisite. On Friday I outlined how to prepare for Day 1 trading in Facebook ($FB). Let’s take a look at a few of these bullet points and see how they applied to the trades that I made in the first hour after $FB began trading. I think it is pretty clear there is nothing sophisticated with the techniques discussed yet they resulted in offering trading opportunities with greater than 1:10 risk to reward.
- Don’t trade it first ticks. Yes you risk not catching some type of initial spike but there may be a complete lack of liquidity and no realistic way of gauging or controlling your risk.
- After the initial move look to identify a buyer at a definite price. If you don’t know how to read the tape via Time/Sales and the Level II then use a “tick chart” to track clear support levels that are developing. But frankly if you don’t know how to read the tape you should not be trading this stock anyway for at least the first 30 minutes after it opens
- Once you identify an area where it is being bought look to get long but get flat if the buyer drops. This is the ONLY way to control your risk! This may happen two or three times before it finally trends higher but this is the responsible way to trade an IPO which can drop much further than you might think. (for reference look at the tick chart in LNKD the day it began trading)
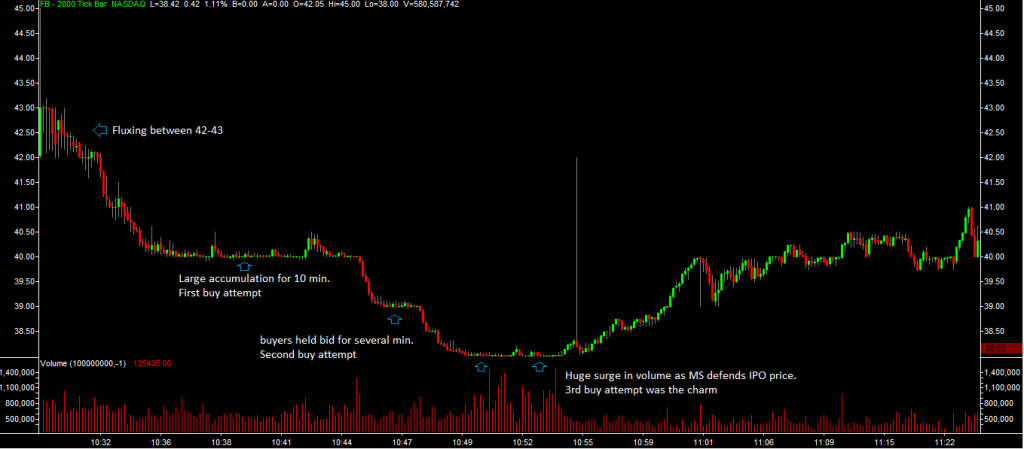
With respect to point number 1 most of our traders respected this rule and avoided quickly losing money in the first few minutes. As you can see from the tick chart the stock was fluxing in a one point range and despite a lot of volume being traded it was difficult to control your risk. Sure you could have tried to buy at 42 a few times and kick it out at 43 but there was no data at that point to suggest what the risk would be if the 42 bid dropped. So how do you calculate your risk/reward?
Bullet points 2 and 3 suggests that we identify a buyer by “reading the tape” and get long until the buyer drops their bid. The tick chart clearly shows a buyer at the 40 level and this is where I placed my first trade getting long. When the buyer dropped I sold my position losing a few pennies. The risk/reward on the trade was about 1:20 assuming 10 cents of risk and a reward of $2 if $FB traded back up to 42.
The second trade occurred at 39 when the buyer began to hold the bid for several minutes again. I bought just above the buyer and sold when the buyer dropped losing a few cents. The risk/reward was better on this trade as the upside was now $3 and the downside was the same as the amount of liquidity available when the buyer dropped had been clearly established.
The third trade occurred as FB approached its offering price of 38. I was a little surprised that it pulled all the way back to this level but watched closely to see if the buyer would step in and buy again. My expectation was that Morgan Stanley, the lead underwriter, would aggressively defend this level as their long term business interests could be negatively impacted by such a high profile IPO trading below its offering price. BUT even if I had no clue about how corporate finance functioned I still should have bought at this level based on the tick chart below. The risk on this trade was probably greater than my buys at 40 and 39 as once the offering price dropped thousands of sell orders would trigger simultaneously. But the upside was still $4 to the 42 level where the stock opened still giving us a risk/reward greater than 1:10.
This was the trade where money was made by professional traders. Both on our desk and on the other desks that I spoke to. The 38 buyer never dropped and during the next 10 minutes FB traded back up to 40. I heard a couple of interesting stories with respect to how traders performed. The best short term trader that I know crushed the move from 38 making six figures. But he gave it all back and went negative trying to capture another “up leg” in the stock. We had some less experienced traders on our desk give back their profits as well doing the same thing.
After the awesome up move ended and FB pulled back from 42 to 40.50 many of our traders spent the rest of the afternoon trying to position themselves for another large up move that never materialized. The question you should ask yourself when attempting this trade is how much of your profits should you be risking on a trade that has an undefined amount of upside and a riskier entry price than the offering price of 38.
Steven Spencer is the co-founder of SMB Capital and SMB University and has traded professionally for 16 years. His email is [email protected].
No relevant positions


