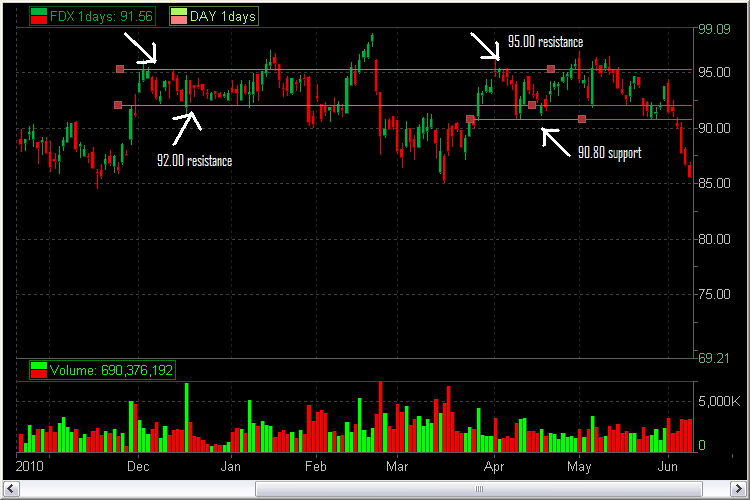
Understanding how to identify support and resistance areas and execute trades at these prices is a prerequisite to become a successful day trader. When I reflect back on the dozens of people we have trained over the years I can’t recall a single trader who made it to consistent profitability who didn’t have a few plays in their playbook that allowed them to create cash flow from this concept.
Today I am going to give you an example of how to identify important support/resistance in a stock that reports fresh news. Then use pre-market price action to confirm whether these levels will have significance for intraday trades.
This morning FDX reported earnings and reacted positively. It was trading in the pre-market above 91. The first thing I did was look at a one year chart to try to find important prices near 91. I was able to identify 90.80 as clear support and 92 and 95.30 as resistance areas. The 92 level was a bit trickier as it was more important back in December in January versus 90.80 which clearly had offered support several times in recent months.
Then I started to observe the pre-market price action. Levels established in the pre-market can be very significant once the market opens. I am most comfortable using these levels if there is a large amount of volume traded at them but they may still be useful even if that is not the case. In today’s pre-market 91.80-92 served as resistance and 91-90.80 served as support. These “zones” should be faded right on the Open. Later in the day it may be a different story.
I have marked up the charts for your review. I didn’t catch the short right on the Open from 91.90 but did get long at 90.80 and caught reversal. And I made one more trade shorting when it reversed again from 92. The one thing you need to be most careful of is not making trades in the middle of an established range. I got away with one such trade around 9:40AM when I shorted below 91.50 and it traded down to 90.80 but it very easily could have traded up to 92 first and I would have been in a position of weakness.


6 Comments on “This Concept Could Get You Through the Learning Curve”
Steve,
I was hoping I could ask you a few questions about your post.
Would you recommend this type of opening play to a new trader?
If this setup were to appear again would you prefer to enter into the pullback or after confirmation?
My last question is, how old could a level be and still be considered
valid for this type of trade or any other? 1 year, 2 years or more?
Steve,
With the massive rush of data presented by the market, it is an essential to have points of reference from which to establish a position. Thanks for your keen insights on how to make sense of it all and manage a position.
Daniel,
1. i think this trade right on the open should be made by anyone who has enough screen time to quickly react if the trade moves against them. i also think that a less experienced trader should probably be a bit more conservative in terms of waiting for the key levels to hold before establishing their position.
2. not sure i understand your second question. do u mean would i enter the trade if it came to support or resistance later in the day? if so, it would depend on the circumstance.
3. the farther back in time u look for s/r levels the less likely they are to be significant. this is probably because very few people who were involved at particular levels far back in time are still involved. i think for day trading the levels that are most important develop in the prior two weeks. for longer term levels on a daily chart i make mental notes if a stock has failed to close above or below a specific level. i will look for intraday reversals at these prices.
Steve
Steve,
but why these levels should be faded on the open? Why not breakout? Is it premarket structure telling us to fade, not to play breakout?
This concept alone can make you a consistently profitable trader.
This concept alone can make you a consistently profitable trader.