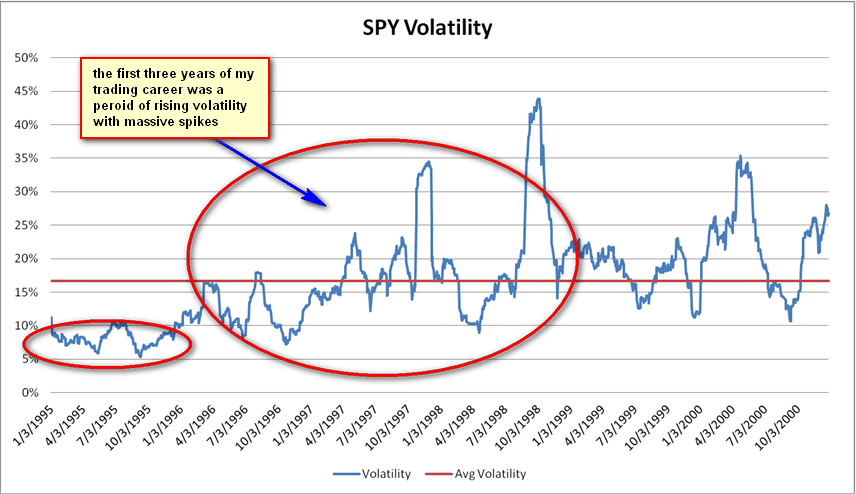
During the first three years of my trading career I participated in a stock market that seemed to move 1%+ almost every day. That market was built for short term traders. But during that same time period regulators pushed through a series of market structure changes that I believe laid the
 foundation for a long term decline in stock market volatility. I now believe those structural changes as well as other technological developments make it unlikely the price gyrations that were once common place will ever return.
Structural Changes
In 1997 the SEC approved the alternative quotation networks known as ECNs to offer competing bids/offers in US stocks. Then came “decimalization” that allowed market makers and specialists to begin quoting in pennies, which reduced artificially high spreads that had existed because stocks were previously only quoted in fractions 1/8, 1/4, 1/2 etc. These two changes fundamentally altered the nature of US stock markets.
Stocks being quoted in pennies instead of fractions tightened spreads, which by definition lowered the risk of market participation. Lower risk attracted more traders and more capital. Trading volumes surged as did investments in ECNs, which began to compete with the traditional exchanges for order flow. This virtuous cycle set the table for further changes that reduced the future potential for market volatility.
There were some groups opposed to these changes at the time. The opposition came primarily from institutions who had been large beneficiaries of the artificially wide spreads (many of these firms paid part of a $1 billion fine levied by the SEC for price fixing in the NASDAQ market). Some Institutional “sales traders” surmised these changes would eventually lead to a huge reduction in their profits and potentially their jobs. They were right. Goldman Sachs has eliminated most of its trading positions in the past decade.
At the same time these structural changes occurred computing power continued its relentless move forward. The combination of these two things led to a permanent downward shift in market volatility. More computing power changed how market participants were able to interact with our markets. It changed how “market making” firms made market and how buy side institutions entered orders into the marketplace.
Firms like Renaissance Technologies hired physicists and data scientists to quantify the mathematical underpinnings of how stocks moved during short periods of time as they reacted to different supply and demand dynamics. The algorithms they built allowed them to make trades in thousands of stocks every day profitably. They were much more efficient than “human market” makers who often relied on “gut instinct”.
Buy side institutions were slower to catch on to the advantages of using technology to open or close their large positions but eventually they caught on as well. They started to use trading algorithms and dark pools for order execution. Ironically, this sort of “direct market access”, had already been achieved by a small group of retail traders in the mid 1990s, via a system that regulators enacted in response to institutional failures during the 1987 market crash.
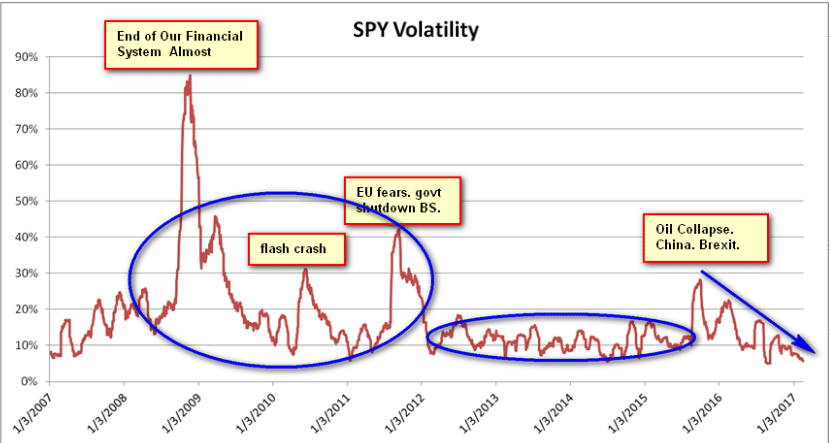
The end result of the structural changes and more computing power was both market making firms and buy side firms interacting much more efficiently with the stock market. This efficiency has created a multi-year downtrend in volatility and reduced the time and size of market volatility spikes we have seen in the past five years.
The Life Blood of Traders
The life blood of most short term traders is volatility. Whether your style tends to be more momentum driven or mean reversion larger short term moves allows you to earn higher returns on your capital. After the internet bubble burst in 2000-2001 the market volatility had become severely depressed by 2002. That is when I began to focus almost exclusively on stocks with a news catalyst rather than continuing to trade a basket of the same stocks each day. A stock with a news catalyst, whether an unexpected FDA approval notice or a an FBI raid, will cause market participants to rush in or out of that individual stock. That is when “trading skill” becomes operative. But even during that period most intraday ranges in the SPY were above 1%.
I don’t think many people have spent time thinking or looking at how these underlying changes have impacted the stock market. Also, the financial crisis in 2007-2008 created conditions that may have tricked many into thinking that high volatility was still a normal part of the market. The flash crash in 2010 and then fears of EU disintegration created short periods of volatility but in the past five years other than a few very brief spikes in volatility the trend has taken us to much lower levels of realized volatility. We are now at levels of volatility that we haven’t seen since 1995 when we ranged between 5%-10%.
100% of trading days in January were below average volatility of past ten years. 3rd time this has occurred. $SPY
— Steven Spencer (@sspencer_smb) February 1, 2017
Adjustments for Short Term Traders
A Few points on what this low vol environment means for different market participants:
- Great if you want to do an IPO if you have a solid business.
- Short term traders must learn how to identify most “In Play” names
- Short term traders should focus on trading stocks that quant firms and large institutions don’t get involved in
- Develop a mean reversion strategy. Preferably on the long side.
I will look to expand on the above points in futures posts and videos. In the meantime, for access to the most In Play names and potential trade setups enjoy a free trial of SMB Trading Tools HERE.
Related Posts
The Stock Market Doesn’t Exist to Serve the Long Term Investor
Capital Markets And Unintended Consequences

Steven Spencer is the co-founder of SMB Capital and SMB University which provides trading education in stocks, options, forex and futures. He has traded professionally for 20 years. His email address is: [email protected].
No relevant positions


