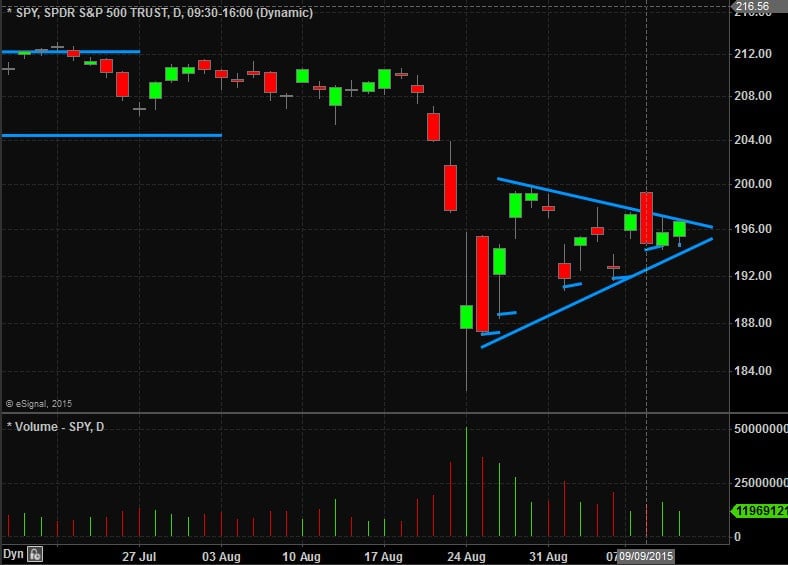
This weekend I have seen a few versions of this daily chart of the SPY drawn with two lines to offer what appears to be “symmetrical triangle”. The idea is that buyers/sellers are becoming more aggressive and when one group wins the SPY will close above/below one of the two lines leading to an explosive move. I’m not a huge … Read More
Trade Review: Student Trade in the S&P 500
In this segment, Marc Principato, CMT reviews a trade in the S&P 500 CFD that was initiated by one of our top students. The trade is based on a pattern from our unconventional methodology. What have you learned by watching? — Marc Principato, CMT Risk Disclaimer *No Relevant Positions Click here for a free trial of our chatroom
Reading the swings in the market
A look at reading the overall market during the trading day.
An important trading skill: “Hey, that’s different!”
Sometimes the best pattern is simply to notice when an established pattern is broken.
Identifying the ABC Trading Pattern: A Key Trend Reversal Indicator
A simple pattern in context of a more complex trading day.
Time of Day Tendencies in the S&P 500
A look at some time of day inflection points in the broad market.
First Ticks – Wrong Ticks
A look at a basic market tendency which forms one of the building blocks of price action.


