I tweeted Friday at 11:45: “That’s probably it today for the uptrend in SPY and the S&P futures.” I want to share a bit of my thought process behind that tweet, because there are some elements here you can incorporate in your own analysis. Reading the market is, in some respects, quite a bit different than reading an individual stock, but it still comes down to the same fundamentals: incorporating a lot of disparate inputs, but mostly focusing on the old-school Wyckoff definition of tapereading, which is noticing how the market acts around important inflection points. My definition of inflection points may be different than most, so let me lead you through my thought process:
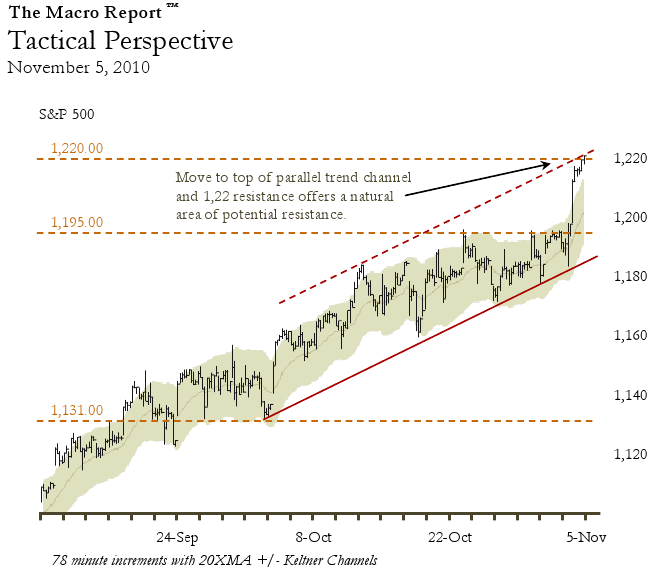
First, the big picture setup. Every morning in my daily market update, we publish a fairly long-term intraday chart of the S&P Cash index. I do focus on a few significant inflection points, but in general I don’t really think too much about “levels” in the broad indexes. The important ones tend to be separated by 50 handles or so, so they are not extremely useful to us most trading days. Rather, I try to identify one or two things that I believe are what I call the “dominant technical structures” for the market at any time. These may be anything from a 5 minute flag in yesterday’s afternoon to an important long term level on the monthly chart, but this drives my focus and my thought process. However, when we are close to one of these important levels, it really pays to pay attention to price action around the level.
Coming into yesterday’s session, I had two conflicting thoughts. The previous day (11/4) was a trend day variation, so my baseline expectation is that today will not be a trend day. (Read this post for more information behind that concept.) Roughly speaking, I think there is a baseline 15% chance we will trend today. However, Thursday was a trend day variation with a long consolidation, so I feel the odds increase a bit, giving us maybe a 25% chance of trending today. On the even bigger picture, we have just broken to the upside from a (messy) multi-week consolidation, so that greatly increases the chances of a trend day, bringing us to maybe 50%. I know that’s a lot of analytical steps, but all that means is that my normal Taylor Rhythm bias for a Z day is nullified and I don’t have any bias from Taylor going into Friday’s session.
Looking at the chart above, I notice that the market is through a very important long-term resistance level. In fact, this level is so important that, when I issued my bullish call on the S&P in the summer, I had this level as my end of year target! I just told you I don’t really focus on levels in the S&P that much, but is this a level I’m going to pay attention to? Absolutely. However, levels in the market do not hold cleanly, so even though we are several points above this level, I know there is a very good chance we will have some volatility here. I do not expect a clean break. The second major factor on the chart above is the parallel trend channel line. I am amazed, over and over again, to see the market react to this technical tool, but the fact is – it works. I have been drawing this line on the daily chart for 2 weeks, knowing that it would probably be resistance. The fact that this roughly corresponds to my long-term level adds more confidence, and I think it is now very unlikely we will cleanly trend higher today. I come into today’s session thinking there is a high probability of a Z day, or even possibly a down day… at any rate, a clean uptrend is unlikely today.
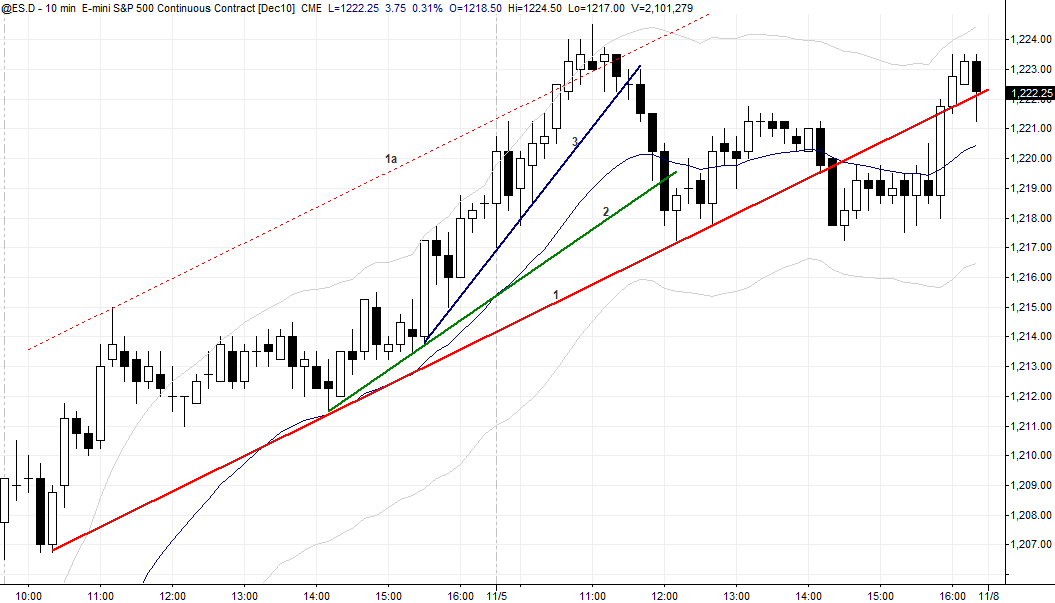
The chart above is a chart I shared with the traders I mentor before the open. (Obviously, it includes Friday’s data so one of the the trendlines was not drawn before the open!) These are the trendlines from a lower timeframe that I was watching, and also was very interested to see if the market could get to the line marked 1A, which was the parallel trend channel to yesterday’s long trendline. I know this is a common spot for the market to fail, so I will not be aggressive about pressing longs there.
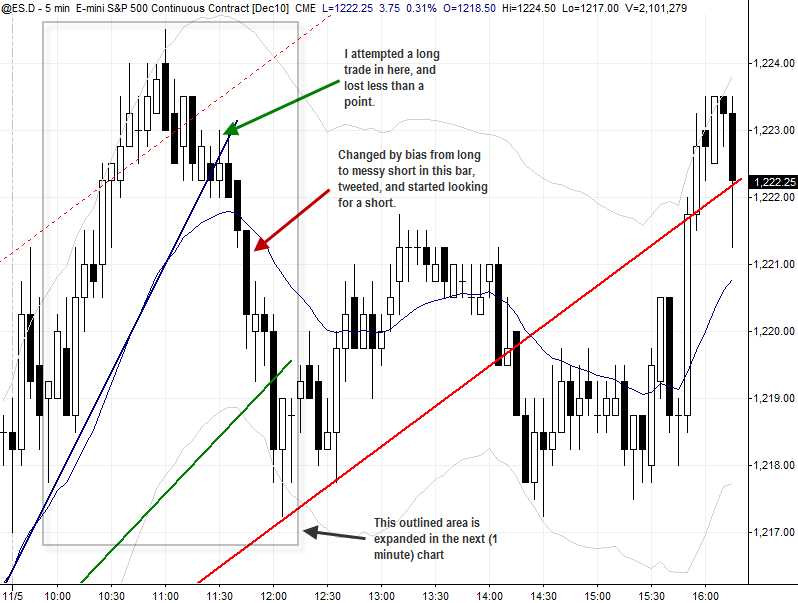
And this five minute chart is the chart I was actually using to trade. (Note that the colored trendlines from the longer chart are carried over to this chart.) Even with all of this background that suggested we would have a consolidation day (range day, Z day), the market was going up off the open and made a clear bull flag. My job is to be in my trading patterns, whether I think they are going to work or not…. so I bought this flag. Now, I was aware that it was the third or fourth (counting yesterday and this day as continuous trading) flag, we were at the top of the trend channel, in long term resistance after a potentially parabolic move, blah, blah, blah, but there is always the chance that the market will blast through resistance and go straight up 20 points… I had to do the trade, but I was very quick to cut my losses at the first sign it wasn’t working and lost less than a point on this trade.
I was not concerned to see the blue trendline broken because I know very accelerated trendlines like that are not usually meaningful on the break, but once I was long it was pretty clear to me that there was really no upside momentum. Time and time again they were hitting the 1222.25 bid in the futures, and here was a case where tapereading actually played a part in a bigger picture technical setup. The market was at a critical inflection point (flag pattern at long-term resistance and short-term trend channel line), and failure of this pattern would be very bad for the bulls.
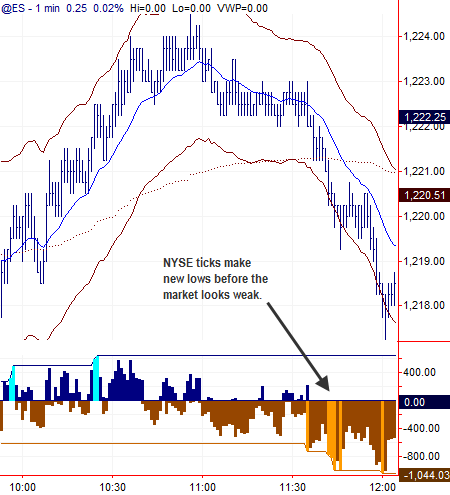
And then the final piece of the puzzle: The NYSE Tick indicator is, without a doubt, the single most useful tool for reading the short term swings of the market. Perhaps I will blog on this in the future, as there is a lot of misinformation and garbage written about this tool. The most important thing to notice about Tick is where the new highs and lows of the day line up with pushes in the market. For instance, if I’m pressing shorts against the low of the day and NYSE Tick makes a high on the day… Houston, we have a problem. In this case, I was leaning long but looking for reasons to be wrong because of my overall technical setup for the day. NYSE Tick threw a number of new “Tick Lows” (lows on the day) at a time the market did not look terribly weak… this, for me, was enough to get out of my long and start looking for shorts… and this was also the point I tweeted that I thought the uptrend for the day was over.
The purpose of this post was to show how multiple technical structures on different timeframes can combine to give you a bias, and why it sometimes makes sense to trade against that bias. I know this post was a bit thick and complicated, but the whole process really is a bit like those nesting matryosha dolls… patterns within patterns within patterns on various timeframes. It can’t be boiled down to a simple formula, but I hope this gives you some ideas you can incorporate into your own trading and analysis. Especially, if you are not using NYSE Tick intraday, I would strongly suggest starting to watch it. Nothing else comes close to the power of this tool for timing short-term swings, if you use it properly.
(An an interesting aside, remember this blog post I wrote? Well, I broke that rule in the afternoon… and was sorry!)
Follow me on Twitter (AdamG_SMB)–I’ll try to tweet more points like this in next week’s trading.


4 Comments on “Reading the swings in the market”
Please give us your thoughts on using Ticks. There is a lot of confusing and contradictory info out there about it. Thanks!
Hi Andrew,
Future blog post. I promise!
Hey Adam, I was wandering what you use to see the NYSE Ticks. Is it a website, a tool on your platform?
much appreciated!
It’s a published datafeed. There is NYSE Tick, NASDAQ Tick, and S&P 500 Tick, and probably more I don’t know about, but I just use the NYSE tick.
Every charting package should have it available I think.