Or at least that’s what I just told the traders on my row 10 minutes ago. I have been spending a lot of time lately trying to eliminate the downside in my personal trading. The good days are good enough, the average days are ok and average out to small wins, but there are still too many days where I sit at the desk and make too many losing trades in a row…. so I have been searching for ways to identify those days early, before the P&L hit is too big. And on those days I should probably just go to a movie or go home, roast some chestnuts and open a bottle of red wine.
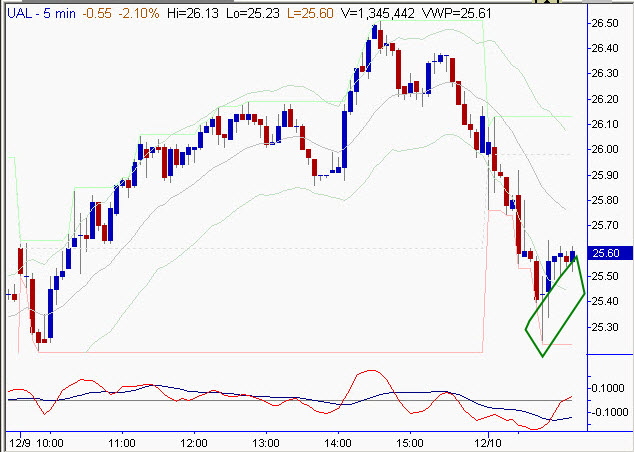
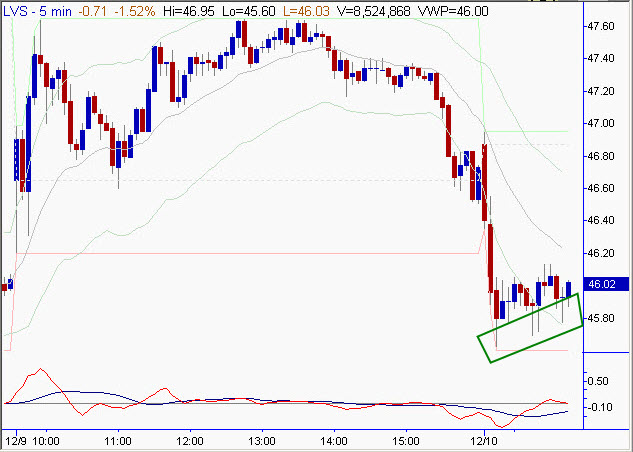
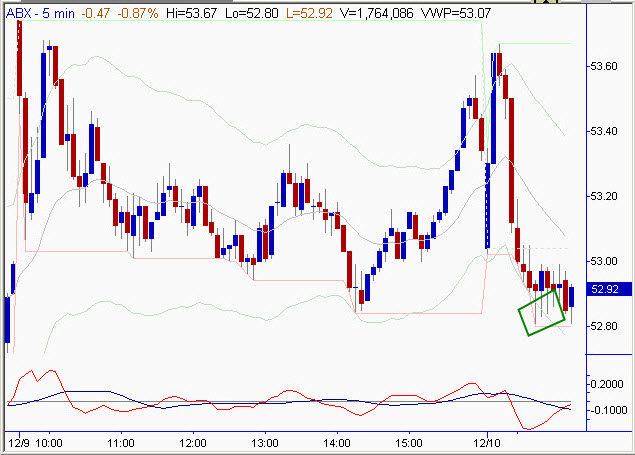
We trade a lot of retracement patterns, in various locations and permutations. Check out these charts. What do they all have in common?
Well, first of all they 3 appear to be pretty decent bear flags… in a different context I would probably be willing to give any of them a chance. However, do you notice the long shadows (wicks, tails, whatever you want to call them) on the bottom of the candles? This points to “hidden” buying… every breakdown out of these patterns has been bought. (This is what old-school Wyckoff-style accumulation looks like on charts by the way.) If you are the kind of trader who might look to play momentum out of patterns like this, you would have been trapped hitting the bids on every breakdown.
Regardless of how you enter these patterns, you have to acknowledge that there is a total lack of momentum or followthrough to the downside… so you can see pretty clearly that this is not an environment that favors your type of play. This is pretty important, so you should pay attention to subtle technical clues like this in whatever patterns you like to trade.


12 Comments on ““Pay attention… this is important””
agree completely – i think candle tape reading under-appreciated in terms of the additional information it can give you, especially if you use a range chart. on that top chart especially looks like spike and ledge potential and would almost prefer to treat the last few narrow candles as a breakout setup to either side!
Bearish flag for all of the three charts above. For me I would go short once the price breaks below the support level of the flags with of course the bearish volume increaseing. Target would be the next level of support.
Excellent point made. Never thought of accumulation in that precise way, but it makes sense.
Thanks again!
Could the wicks be shorts covering?
yep, but we have no way to know. imo we spend too much time trying to figure out who is buying and why… does it matter whether it’s short covering or buying to establish a position or whatever else? i dont think so… just matters that we see the buying.
continue to think about this. “wicky” support areas are often great buys.
ummm… plz read rest of the post. yes they are bear flags but there’s more i want you to see
agree. one of the people who was very influential in teaching me to trade considered herself a tapereader though she didnt use the level 2. was a kind of tapereading that basically involved picking up subtle clues around inflection points… i consider this kind of thing to also be a form of tapereading. (this works on longer timeframes too btw)
Question: Were you just early on these at those points? Seems they did break down a few minutes later: http://www.flickr.com/photos/93631461@N00/5254922884/ ABX was similar…UAL and ABX trended higher after a short term drop from that but LVS Broke down and trended down the rest of the day.
This is a great article. I’ve seen this pattern so many times and have thought the same as you have written but stubbornly stuck to the trade.
Would you mind expanding on what you would consider a confirmation that the bear is continuing – OR – convince you to go long?
For example – using the last chart – would you consider the last candle a second test rejection of the low after the very bearish bar as breaking the descending trend line (quoting Al Brooks) and go long or wait for more confirmation? Would you wait for a candle to break the support low as confirmation of a bear continuance?
Perhaps and that was something I was thinking about for the rest of the day. Always the possibility that the market could have collapsed 30 seconds after posting this blog, leaving me looking pretty stupid! 🙂
I think my point was correct, which is that I simply want to be in the best and the cleanest trades. Too many of my crappy trading days start wtih 3-4 trades that “sort of” dont really work. For instance, I get my first profit target on my trades about ~80% of the time and if I have 4 trades in a row where I don’t get the first profit target, something is probably wrong either with me or the way I’m seeing the market.
You’re right… some of these trades went lower on this day, but they did not move in a way that I would have wanted to participate in anyway. At the end of the day, I felt pretty good about my decision to back off for the day. (FYI, found some long trades in financials and ended the day basically flat.)
Makes sense…I see what you mean. If you are not 100% confident in what you are seeing, move on. Funny thing is I had just printed out this chart and put it on my wall after reading a few of your articles: http://www.flickr.com/photos/93631461@N00/5257956980/ Keep up the great work!