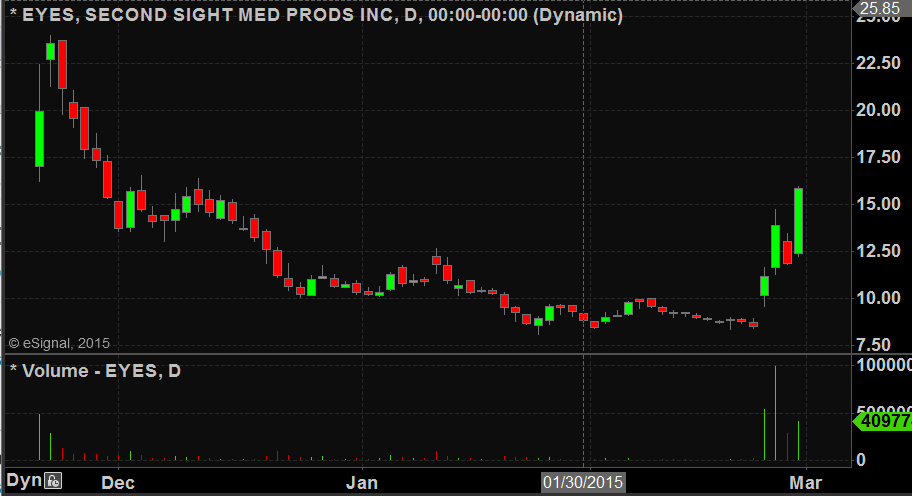
Take a look at this daily chart for EYES. In the past three months one day in particular stands out. Something that is “not like the others” from a price and volume perspective.
What does that day signal?
What sort of price action would you look for following a day like that?
What trading setups and time frames would you use after that sort of signal?
I invite our blog readers to offer their thoughts on this. Sometimes a blog can be more helpful as a place to discuss ideas among well informed and bright people than a one way information dump!
Please share with others your thoughts on this stock as well as any trades that you may have made. Thanks!
(I will post my thoughts tomorrow)
Steven Spencer is the co-founder of SMB Capital and SMB University which provides trading education in stocks, options, forex and futures. He has traded professionally for 18 years. His email address is: [email protected].
No relevant positions


8 Comments on “Open Your EYES!”
High volume on 2/24 signaled institutional buying. It closed near the highs. 2/25 take the gap & go over the premarket high looking for some continuation. Trade it on 15 min chart holding until it cut into the prior pivot under $14. 2/26/ gap down. go down inside profit taking day, sit on hands. 2/27 Mid gap showing strength and take long over prior day high, trading 15 min chart and holding to 15.75 break of 15 min candle bottom at 15.75 selling full position as price was extended to about 4x a one day ATR.
Maybe short covering followed by more short covering then looking for setups in a 5 minute chart.
Then again probably not short covering due to recency of IPO and short float being so low. But institutional previously recorded ownership also low. Long bias on 5 minute chart.
There is no fundamental reason for this company to be up that much. The news are completely meaningless. The run on friday was primarily caused by the SSR and the share structure imo.
The news may or may not be meaningless. Retinitis Pigmentosa or anything biotech for that matter will always be difficult to understand. Also a recent Nasdaq IPO, especially in the biotech industry, might be regarded differently than an OTC pump and dump that is up the same amount.
It’s a low float stock. That much volume means that traders are buying and selling to themselves. The “news” was only a catalyst for excitement.
The following day would need a continuation of high volume. If that volume dries up, you don’t want to be stuck in this thing.
I would look for flag patterns, and channel/trendline breaks. It would be entirely Move2Move because there’s nothing fundamental about this company that should suggest you hold overnight.
It’s playable to the long and short side, and I would expect to get short on a failure to regain new highs after a parabolic move upward (intraday).
I know I’ll get smoked for suggesting this, but what about the Jan 26 candle? After 2 months of selling, stock bottoms with a nice bullish candle – reversal day. Enter a small long position on the 27th w/ stops just under 8.05. Also interesting is that it seems like the only pivot/significant day for the SP that cannot be confirmed by volume bars – to me that might indicate that mm’s playing the stock on a daily basis had decided enough selling and perhaps anticipated a near term catalyst?
Short on the gap down on day 3 after the big volume run to 15 as longs are looking for the exits, and when it fails to hold previous day support (13.50). If you swing it, cover back above 12.5-13 depending on your wiggle room. For now, nothing points to a short unless you want to get smoked. I’d press it short if it fails and holds below 15.35-.50 area for a pull into the higher 12’s.