I will try to make this post short today. I have been focusing more on trading in-play stocks with the same technical tools that I have applied to index futures, and the results have been pretty impressive. My actual bottom line P&L has not been that great because I am not being consistent with my risk, but that’s a topic for another blog post (and a goal for me this week.)
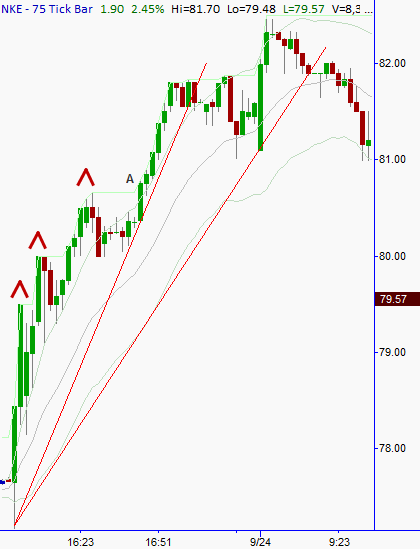
I came in in the morning and NKE caught my interest in the first few minutes. I punched up a tick chart of overnight action and saw this:
A few things about this chart are important. First, I had to go all the way down to 75 ticks to see meaningful patterns, which tells me that the stock was not all that in play. So I am expecting choppy trading and wide spreads (both of which we got), still there are some interesting after hours patterns here. Here is how I read the overnight when I punched it up that morning. I see 3 pushes up to the point marked A, which is a potential reversal pattern, then a longer consolidation at A. The potential trend ending pattern fails, we have another large extension up to a more complex consolidation that holds resistance just around 81.80. A pop through that early this morning tagged 82.50 or so and then immediately failed… all of this suggests a stock that is up but primed for reversal and failure. As we are set to open I see two possible outcomes. It is possible that this 81.00 support area will end up being a small double bottom as the stock trades higher, but if that fails I see considerable downside targeting a possible gap closure. (Compare the chart above to a time based chart and again you will see why I firmly believe that tick-based charts are absolutely critical for understanding overnight action.)
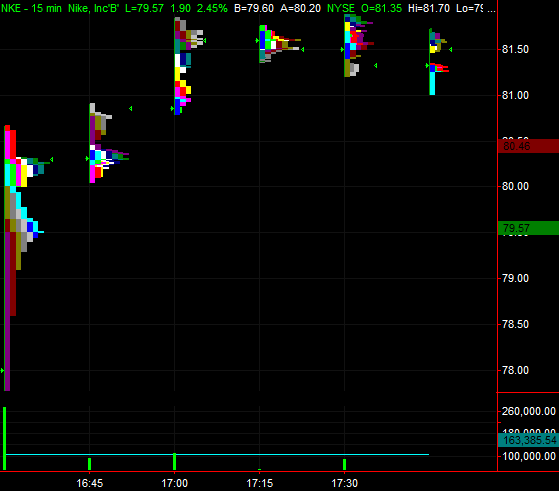
Friday was a slow morning so I also took a look at overnight action on a MarketProfile type chart to see if I was missing any big volume areas.
I am far from an expert in MarketProfile, but the “bumps” to the right of these 15 minute bars show the price levels where volume was actually done. In this case, I see no sharp level, but 3 general areas that confirm the volume was done in the same areas I identified as consolidations on my tick chart above. I only check MarketProfile when I have a lot of time on my hands, but it does sometimes show things that you cannot see otherwise. In this case, no value added.
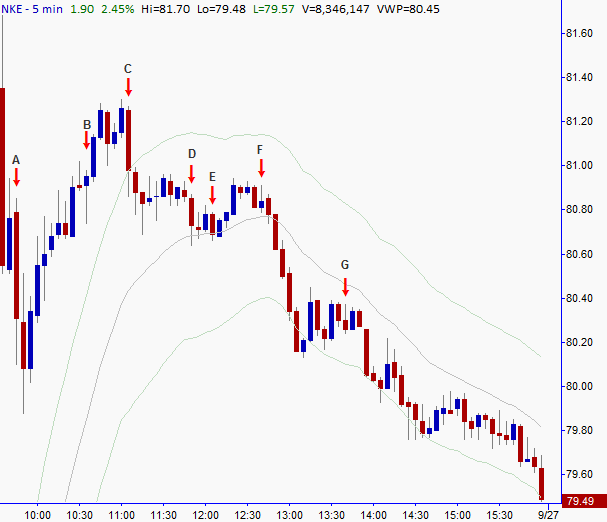
So the day session opens, tests that 81.00 twice (potential double bottom for the bull flag), but then melts through on good momentum. From that point on, I am leaning very hard to the short side. I think if you compare the trades above to my earlier posts on RIMM, you will see many of the same trades. Again, the same boring patterns over and over. In this case, the moving averages are not useful because of the gap up. Some general comments on the trades:
A-It pays off to be aggressive with breaks out of tiny consolidations when you think a stock is poised to trend. These are high-risk entries, but the reward justifies them. If this trade doesn’t make sense, look on a 1 minute chart and it will probably be more clear.
B-Another aggressive attempt to short, but I was too quick on this one. I didn’t want to miss the trade but this was not a great setup… only included here in the interest of full disclosure. This was a losing trade.
C-THIS was the trade of the day in NKE. Double top test of a bear flag, after sharp downward momentum. The retracement is a bit deeper than is perfect, but these ratios are only guidelines. (I am not focusing on levels at all at this point, but only on the unfolding price action. This, to me, is what is driving the stock at this point.)
D-I really love this trade when you can find it. A breakdown of a small consolidation within the breakdown of the larger pattern. In this case, the C entry is targeting new lows on the day, so we have added confidence on this short entry.
E-same, but losing trade. Nonetheless, a good entry.
F-a better pause and another good short entry.
G-entries in this general area are also excellent. I took a trade here and did a crappy job of managing the exits. (Note that the low preceding G was nearly exact measure move target for CE / F downswing.)
I made a little money trading NKE today, but realistically probably not 25% of what I should have made due to two critical errors: I was not consistent with the risk I assumed on each entry and I did not manage exits properly. Both of these are high on my to-do list this week.


