Before I start to break down each StockTweet I want to share some background information for this trade. FB reported a huge fundamental shift in their most recent earnings report on July 24th. FB’s mobile revenue as a percentage of its total revenue doubled. This was a game changing piece of information as the largest impediment to FB’s stock performance was the widely held belief that it would fail to monetize the shift to mobile by its users.
Since that report my Big Pic focus has been on the long side. Even with its enormous float FB is now a momo stock that will continue to move higher until there is a change in its fundamental picture. This particular trade is what I call a “post earnings pull back”. Usually in the days following a good earnings report a stock will pull back into an area that larger players are comfortable accumulating. Figuring out where this area will be takes some experience and should be confirmed by price action and volume.
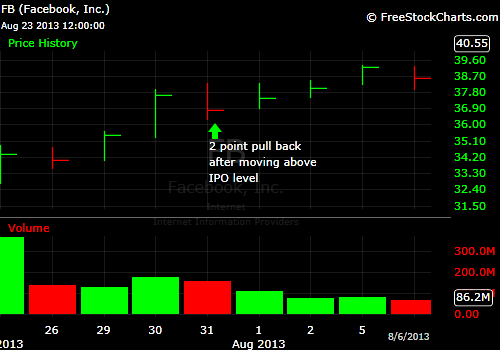
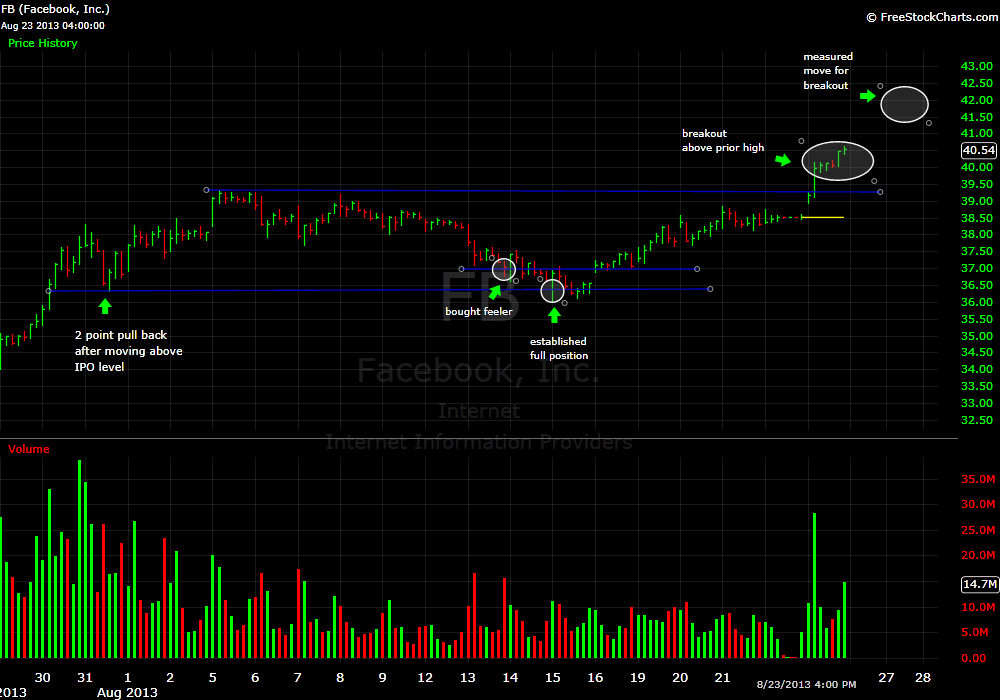
In the case of FB my “load up” area was on a pull back to 36.30. FB ran up following its report from 32 to 39.30 and its only significant pull back during that run was from 38 to 36.30 on July31st.  I participated on that brief pull back on the short side before re-establishing a long position for its final up move to 39 (that short and flip back to long were tweeted real time as well). I made a mental note to myself it FB were to have a pull back from 39.30 to 36.30 to put on a full size position with stops below 36. My view was if this area supported the upside was at least a test of the prior high (39.30) so the risk/reward would be well above 1:5 making it an A setup. Also, I try to put myself in a position of strength for breakout trades, and if I am long from 36.30 and FB sets up well for a break of 39.30 I have a lot of wiggle room in terms of how I can manage the trade from sizing to stops.
The following StockTweets began on August 13th when I initiated a “feeler” position in FB and continued until August 23rd six days into my Nantucket vacation, which to an extent has caused me to adjust my handling of the position as I am not allowed nor do I want to actively manage this position each day 🙂
FB had moved down to 37 fairly quickly and I put on a “feeler” position to make sure I started to follow it more closely. As a rule of thumb I won’t risk more than 10% of a full position’s risk on a feeler. So for example if my total planned risk on a trade were $1,000 the initial feeler would have no more than $100 of risk.
This was just a reminder the following day that the “value area” was lower and to have the most favorable risk/reward I would want to put on more risk in that area. It never traded down on this day so I did nothing with my position.
The market gapped lower on the Open this day and I think that helped me get stock at the prices I really wanted. I think my best price was 36.12. On a pre-planned trade like this where I know I will be exiting below a clearly defined level I will try to get extra size just above my stop. In this case I failed to get any stock just above 36, which was poor execution on my part. I didn’t anticipate such a quick flush to 36 and reversal on the Open but apparently the move may have been options related. There was massive call buying this day and that was probably the catalyst for the quick pop to 37 as the market makers selling calls were buying common to hedge their positions.
Later in the day FB pulled all the way back to 36.12 so anyone who wanted to be long from that area was given ample opportunity. I am aware of one other trader on our desk who got long besides myself. The reason I bring this up is most short term traders are extremely uncomfortable with the entries I have highlighted as the shorter term moving averages are moving lower and sellers are in control at this point. However, I am making this trade based on my experience that the largest players will be buying the stock closer to 36 as their best chance to build larger positions are once there is some fear in the stock. A more conservative approach to this trade was recently outlined by Brian Shannon in this post here.
I was positioned exactly where I wanted to be. My average cost would ensure at most I would be risking less than 40 cents on a position that I viewed as having $3 of upside to the previous high.
The market continued to sell off following its gap lower yet all of my pull back buys in individual stocks were bought. To me this is the sign of a healthy market. The SPY which technically had failed to hold above 169.90 in prior days was starting to roll over a bit but individual stocks that had come into likely support areas were being bought.
Whether I am in a position or considering to enter a position the price action needs to build “a case” for me to have confidence in my trade thesis. Now that FB supported the area where I expected large buyers to step in it needed to show me it could “hold higher.” That price action would be a confirmation that buyers were becoming more aggressive and beginning to assert more control. Some traders use moving average or different measures of VWAP to make this assessment. I use recent S/R areas.
The day I entered my “feeler” position in FB it had trouble at 37.50. It had trouble there the following day as well. This to me became a possible resistance area once it had bottomed. This is a spot you could sell 25% of your position to cover risk on a swing trade and more aggressively sell if your focus is intra-day and you were buying on the Open when it supported 37.
I think the single biggest thing I do on swing positions that improves my risk/reward is I am incredibly picky on the prices where I put on full risk. This pickiness causes me to miss some positions as they don’t pull back to my ideal prices but the upside is the size of the draw downs I experience for a single position are very small relative to my upside if a trade unfolds in my favor.
FB was in that 38 IPO area where it could pull back 50-75 cents. At this point I am in Nantucket on vacation so there is no way I can actively manage the position so with my risk covered I am waiting for a test of the prior high of 39.30 to evaluate and take more profits.
I wanted to share a picture that shows the buyers have clearly regained control with the hourly downtrend broken but possible resistance around 38 where it broke down from on the 13th.
FB is now consolidating above the 38 level which will lead more market participants to become confident in a test of the prior high and then 40. Little did I know with the firming of the market that 40+ was going to be in the cards sooner than I expected.
FB gapping higher in the pre-market is foreshadowing a possible breakout later in the day. The key in this situation is to watch the size of the pull back when the market opens with a shallow pull back most often leading to a breakout later in the day. The cool thing about this is a move to a new 52 week high will attract some more momo players providing more protection for those who want to press their longs for a move higher.
I figured that FB would maybe run up closer to 40 before pulling back and testing the 39.30 level. I was somewhat impacted by the fact that I was on vacation and couldn’t actively maange the positon. As it turned out it consolidated above the prior high and then broke to around 40.50. I figured best case for its next move would be 41-42 and we may see that on August 26th.
In a bull market if you can identify potential areas of support in market leaders you will do extremely well as a short term trader. In July/August I can only recall two instances of pull back trades in the leaders not working and at least 4X that number working. If your win rate is above 50% AND the risk/reward is 1:5 you have a very high positive expectancy.
If you found value in this post please share via buttons at the top
Steven Spencer is the co-founder of SMB Capital and SMB University and has traded professionally for 17 years. His email is [email protected].
Steven Spencer is currently long FB


