I have to admit I found the reaction to my last post very interesting. I struggled to write that one because I thought I was writing something that was kind of cerebral (big word for “geeky”) and wouldn’t really be interesting to the community, but I was happy with (and surprised by) the response it got. Many of these posts you see here are coming out of my work on the new Advance Technical Analysis program. I think a good understanding of probability, expectancy, and the nature of randomness are critical for a trader’s long term success in this business. I will write a bit more on this topic in the near future, but I want to share another way to look at the issue today.
In my last post, we saw that many of the patterns we see in markets also appear in random data. This is true, but we should not necessarily draw the conclusion that market data is also random. (That’s backwards reasoning. If all firetrucks were red, we cannot say that all red trucks are firetrucks.) There is actually a raging debate in some circles about how random market data actually is, but for today I want to leave you an interesting and instructive game. (I emailed this to about a dozen traders a few weeks ago, and only one replied. Most people have already had enough of my silly games. 🙂 )
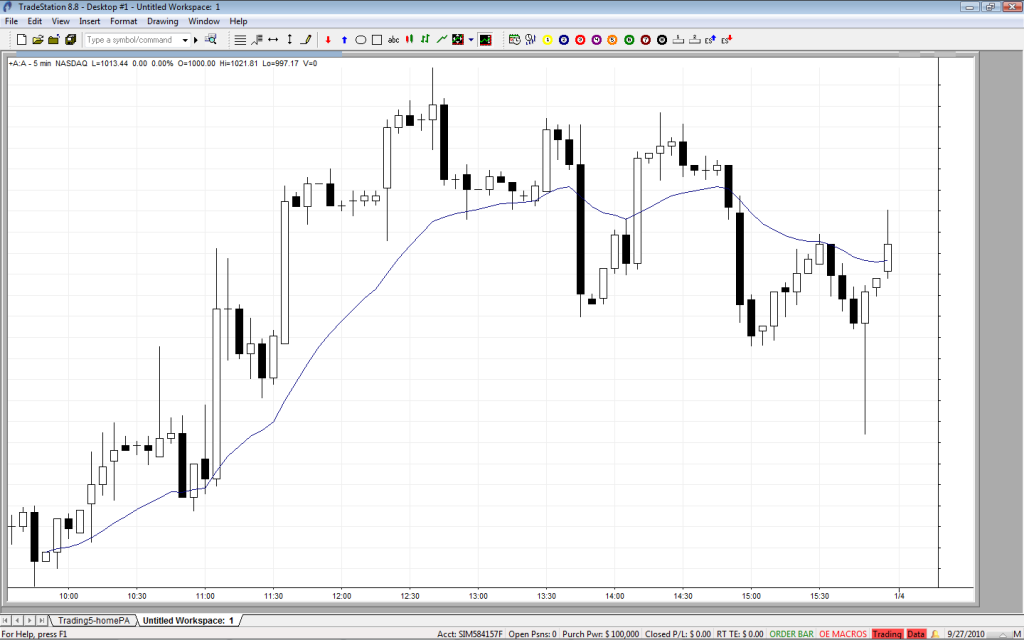
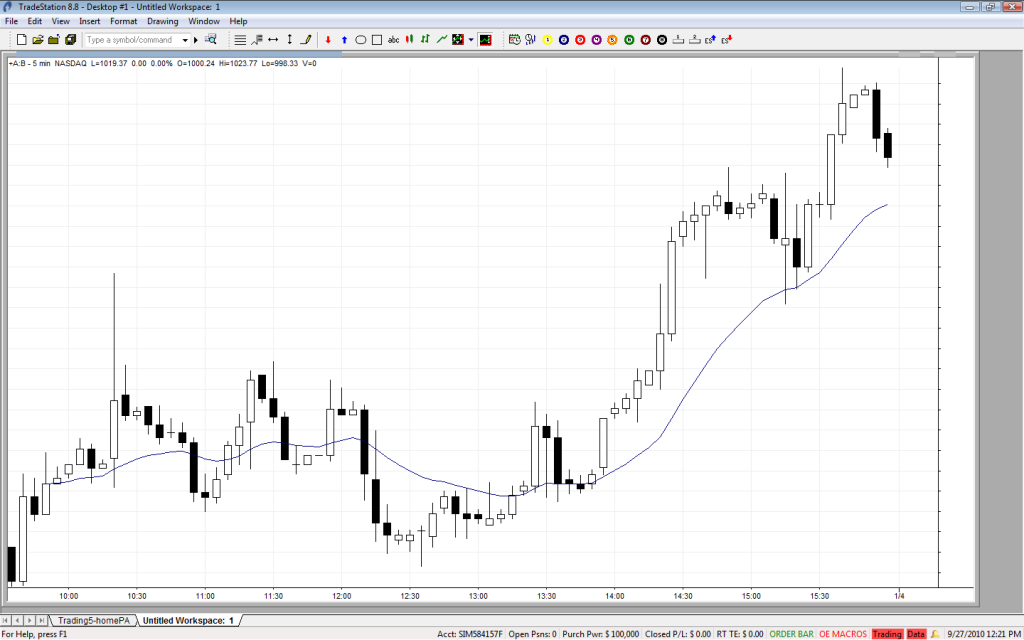
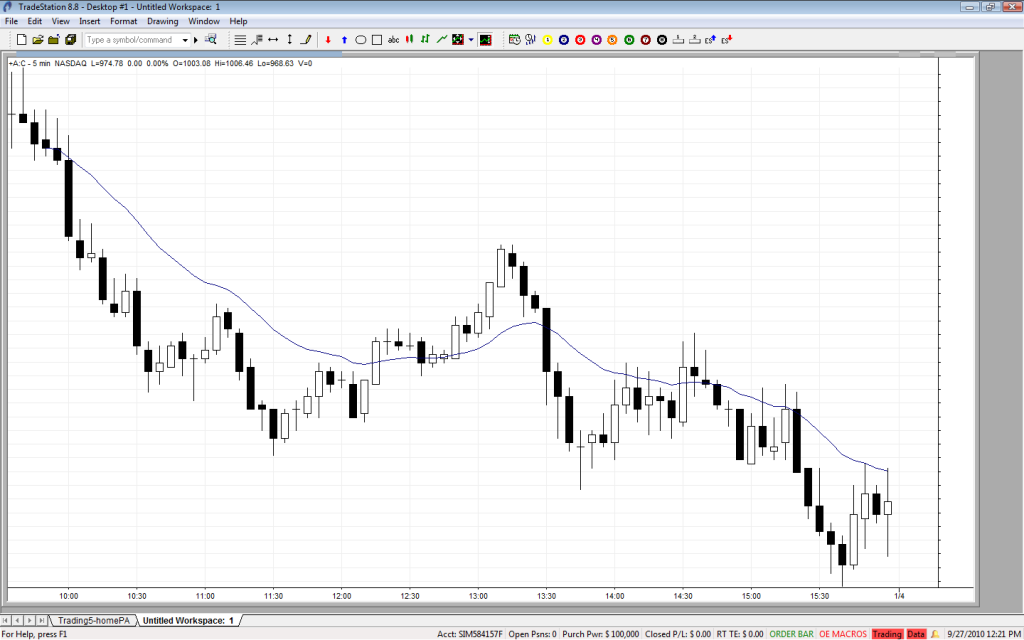
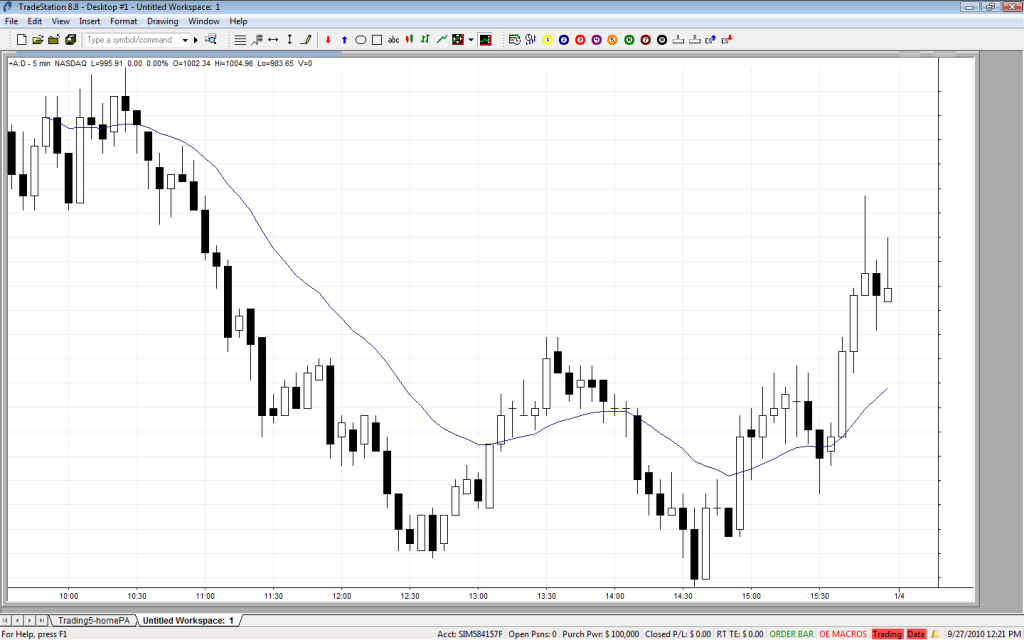
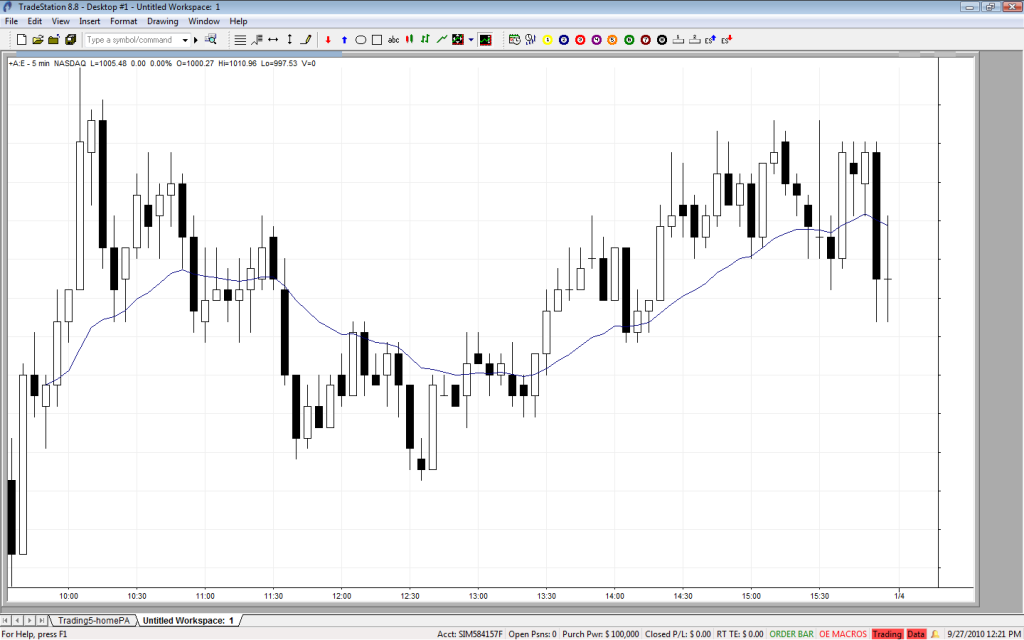
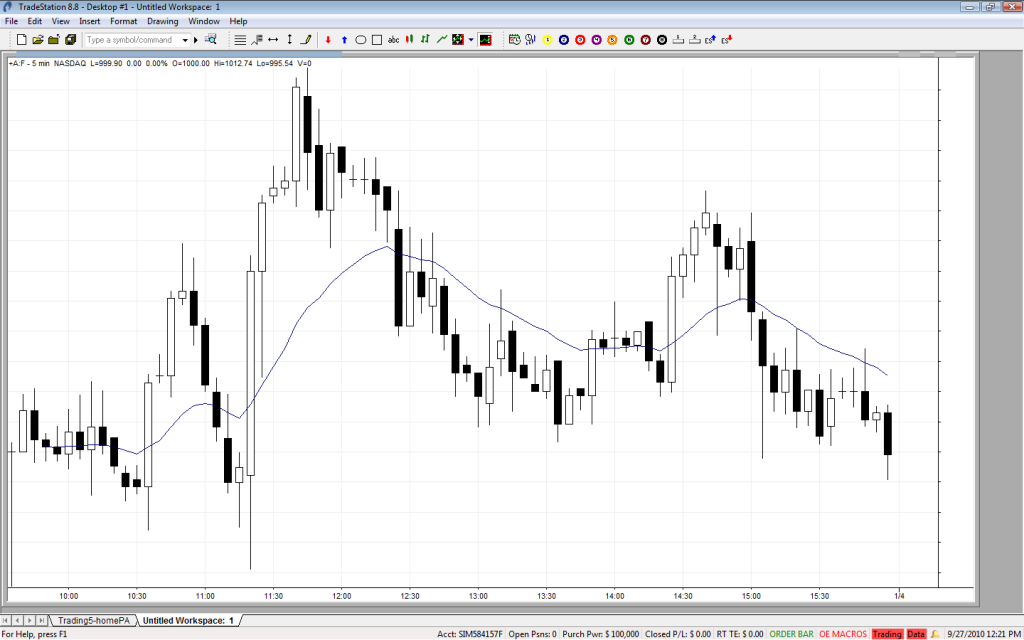
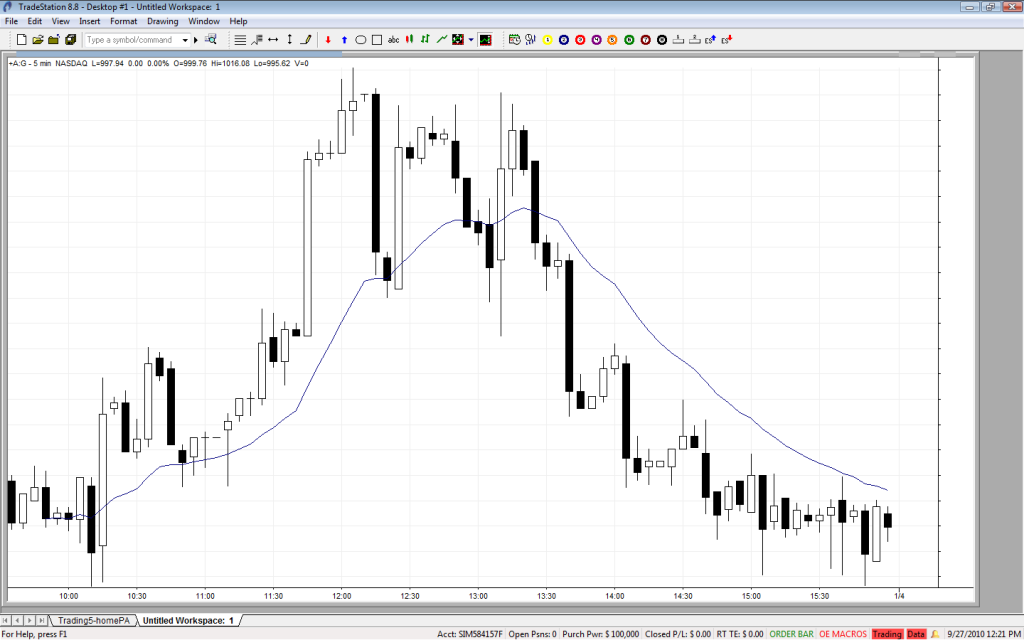
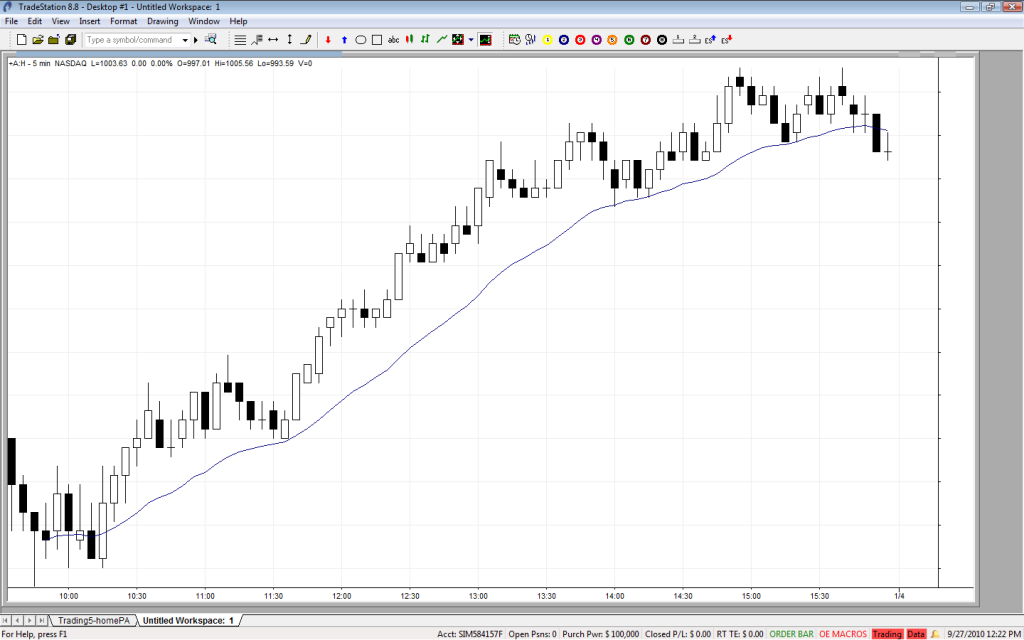
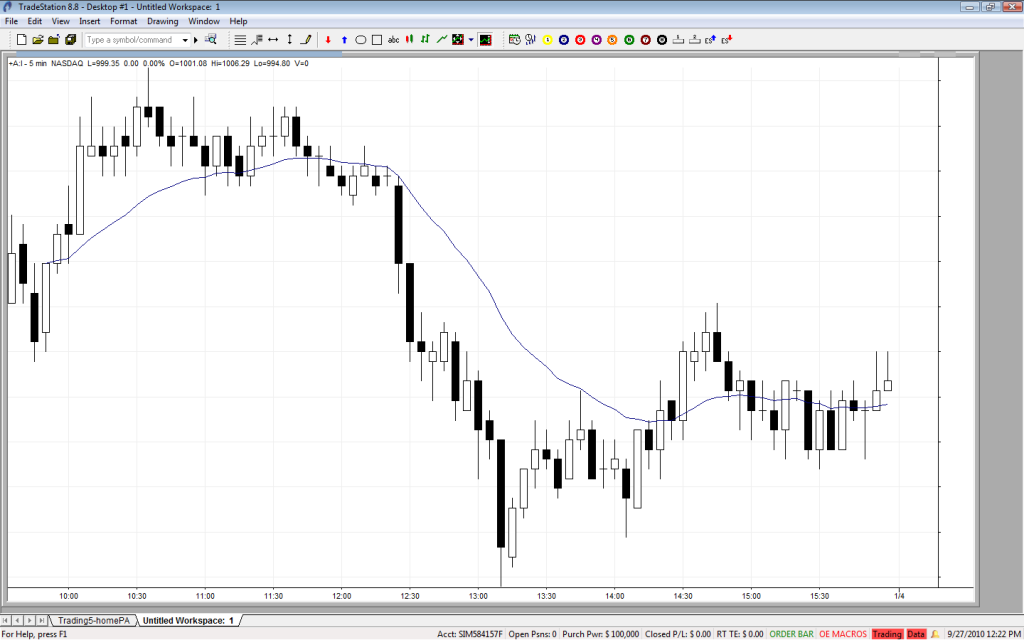
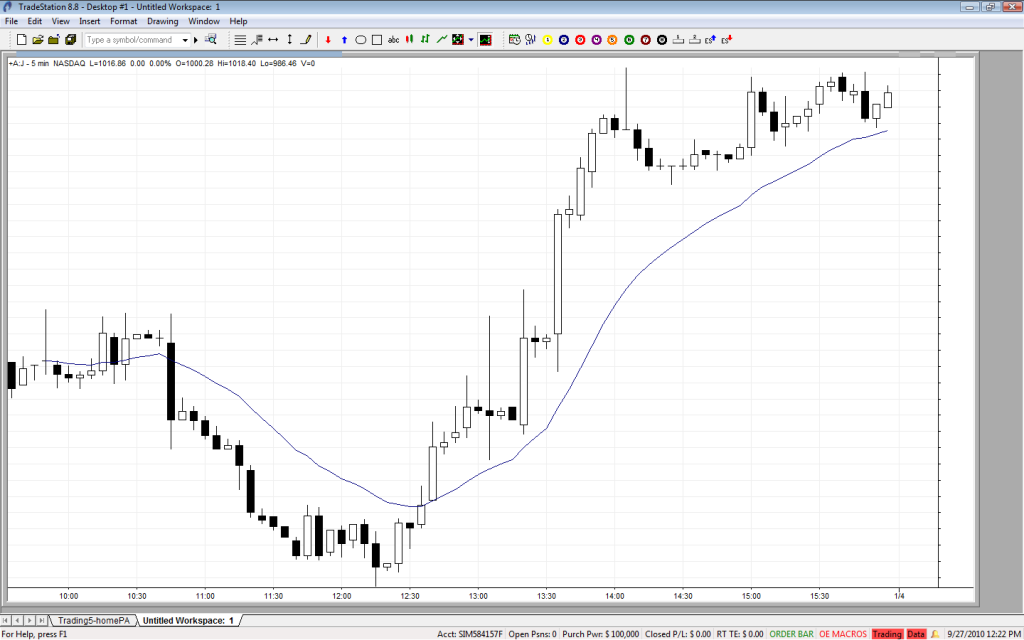
There are 10 charts below, all including a single trading day of 5 minute S&P futures bars, with a 20 period exponential moving average. 5 of the charts are actual trading days, but 5 are impostors… very good impostors. They were created by taking all of the 5 minute bars for the past two years, shuffling them, randomly drawing them out of the bag (sampling with replacement), and then linking them together to create a fake trading day. (As someone alluded to in the comments to the last post, one of the issues with generating random data is the distribution of returns. This solves that problem by sample actual trading data.)
So… the question is… which are fake? In my opinion, there are two fakes here that are absolute layups, and then two that turned out to be more difficult. I am guessing most traders should be able to identify 4 of the 5 fakes pretty easily, but most importantly, jot down your reasons for why you think they are fake. We’ll revisit with answers in a few days.
(Why is this important? Because it drives right to the issue of what is not random about markets…)

15 Comments on “Another look at randomness”
Even with random data markets trend, find me a trending mkt and I will take a slice of that
pie good point though, defining random and randomness in trading are different issues, overall I do
not think mkts can be predicted but they can be traded due to the persistence of trends, ie directional movement. Good trading!
I applaud your follow-up post. Without the clarification on the reasoning (all firetrucks are red; not all red trucks are firetrucks), some may fall into the trap of thinking the market’s random.
First, thank you for your recent insightful posts.
Then, my answer (guess?) is:
The fake charts are chart A, B, G, H and J.
The reasons are: (assume the price was unfiltered)
1. To me, they are all looked uncomfortable. Not a good reason. 🙂
2. Chart A, B and G all include a one price 5 min bar (“-“) in the two and half hours period after opening. All the traders suddenly decide to take 5 min break in the regular trading hours. 🙂 This bar (“-“) possibly was pick from the sample of after hour trading, especially between the U.S. close and Europe open. Also, on these charts, the price is abnormally volatile, the big trend bars happen too often at normally no news time. On chart B, the huge reverse bar in the morning is strangely break out and tested in the afternoon treading.
3. On chart H, the price is too strong to believe. Feels that it is no real market trading type. Also, in the EMA trading around bar 11:35, there were no tails on both sides of bar 11:40 and 11:45. This was not the normal emotion type of EMA trade.
4. Chart J represent a strange emotion development. Especially, the bar 13:05 is a huge doji. After price make a big down, big up and down and finally form a huge doji, the next two bars are such narrow bars. The market emotion “cool” too quick to believe. 🙂
Hopefully, I can get “C” in my guess.
I like the style of your posts. Thank you again for your contribution in this blog.
4 strike me as looking real: C, D, H, & I. 4 strike me as looking fake: A, B, G, & J. E & F are a toss up with the nod going to E as looking more real than F. Speaking of looking fake, how about the first hour of 5 minute bars in the ES today?
Dunno if this even possible.. question marks by the hard ones
A fake
B real
C fake?
D fake
E real
F fake?
G fake
H real
I real
J real
Fakes are B,D,F. I’ll choose E also though I didn’t feel strong about it. Couldn’t come up with the 5th.
Jack did a better analysis because he looked at the time of day. I just looked at the bars so probably got half wrong.
A fake
B real
C fake
D real
E real
F fake
G fake
H real
I real
J fake
Adam, I believe your last post showed empirically what most of us already know: that a future outcome of the market cannot be predicted. The market is random in that sense, I dont think anyone would deny that. However no one can deny either that there are people who consistently profit from the market. If both data are indistinguishable to any kind of test, it leaves the question, what are the consistently profitable people trading?
I believe there are certain repeatable patterns, found both in ‘random’ data as in market data, that tend to resolve themselves in a certain manner. Simply due to ‘nature’. If one can identify these patterns and stick to trading only those, then it is possible to extract an ‘edge’ even from random data.
Key assumption 1: the fact that data is random in the sense that it cannot be predicted X periods in advance does not necessarily mean there is zero information in the data.
Key assumption 2: human psychology is patterned, thus giving the patterns in the market (from the fact that your sims from the last post are virtually indistinguishable from market data, i am making the inference that the same natural process that causes human psychology to be patterned causes the random data in your sim to be patterned in the same way. ie. it is impossible to know what the reaction of a single human might be, it is impossible to know what the outcome of a single coin toss will be, but on the aggregate, for some reason or another, self-emergent patterns appear.) this can just be taken as a fact of nature.
Conclusion: all random data is not truly ‘random’ – there are different types of randomness, meaning and information in an unpredictable system.
Lesson: identify and stick to those patterns 😉
Interesting article. I would say the fakes are A,B,F,G,J because of the apparent randomness of the candle sizes… More a feeling than a scientific analysis though. looking forwards for the solution!
Fake A,B,E,G,J
Real C,D,F,H,I
I based my conclusions on how the candles worked with each other. The more wrong the combinations of the candles looked, the closer I came to my conclusions.
Looking forward to the next post!!
Ok guys… good answers. I was going to post the “answer key” here, but I’ll do it in a whole new post… probably later tonight or tomorrow at the latest.
Thanks for the answers.
Fake : A,D,F,G,J
True : B,C,E,I,H
2 4 7 8 10 are real
c,d,h,i,j are fake