This post is another in a series that we will be publishing over the next month , tracking the hypothetical performance of broken wing butterfly trades selected by Greg Loehr of Optionsbuzz.com.
If you’ve been watching this hypothetical AAPL 610-605-595 put butterfly that expires today, then you’ve seen how dynamic this strategy really is. With the sell off down towards the body of the fly, this position has traded anywhere from a hypothetical 20-cent profit up to a $1.70 profit, and there’s still more than two hours to go. The interesting thing is that even though AAPL traded below the short strike of 605, the trade didn’t enter a hypothetical loss.
This afternoon the hypothetical butterfly could have been closed for a credit of $1.50 which comes to a $1.55 profit after factoring in the 5-cent hypothetical entry price. So over the one-week time frame for this example, on a risk of $4.95, this trade returned a hypothetical profit of 31%. That’s calculated by taking the projected profit of $1.55 and dividing it by the risk of $4.95. We’ve now tracked four hypothetical broken wing butterfly trades in the past several weeks, each one producing hypothetical profits of 1%, 1%, 6% (SPX) and 31% respectively; all over one-week time frames.
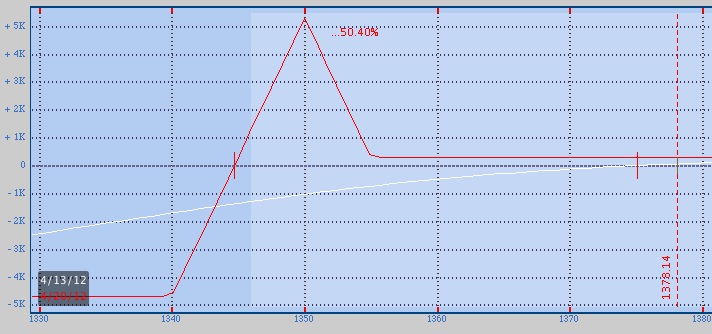
Going back to SPX now I’m going to be tracking over the next week a hypothetical April 1355-1350-1340 put fly (ten spreads) with an entry price of a 30-cent credit. This setup is similar to the previous example we followed on the SPX. If the market rallies into expiration week, then these puts will all expire worthless and the hypothetical profit at that time would be the 30-cent credit divided by the maximum risk of $4.70 which comes to 6.4%. The maximum profit is theoretically $5.30.
Trade safe!
Greg Loehr
Optionsbuzz.com
Please note: Hypothetical computer simulated performance results are believed to be accurately presented. However, they are not guaranteed as to accuracy or completeness and are subject to change without any notice. Hypothetical or simulated performance results have certain inherent limitations. Unlike an actual performance record, simulated results do not represent actual trading. Since, also, the trades have not actually been executed; the results may have been under or over compensated for the impact, if any, of certain market factors such as liquidity, slippage and commisions. Simulated trading programs in general are also subject to the fact that they are designed with the benefit of hindsight. No representation is being made that any portfolio will, or is likely to achieve profits or losses similar to those shown. All investments and trades carry risks.
No relevant positions.

