This post is another in a series that we will be publishing over the next month , tracking the hypothetical performance of broken wing butterfly trades selected by Greg Loehr of Optionsbuzz.com.
A week doesn’t go by when I’m not asked a question about selling a put spread (credit spread) on a particular stock, especially before earnings when the implied volatility is typically higher than normal. Take Apple for example. Earnings come out next week, the volatility is high, and selling a put spread is a high-probability trade. Now forget the fact that a vertical spread actually reduces the exposure to the volatility so it’s less of a “volatility trade” than most people think, but we’ll leave that discussion for another time. But let’s look at a couple of hypothetical trades and see how a credit put spread stacks up against a broken wing butterfly.
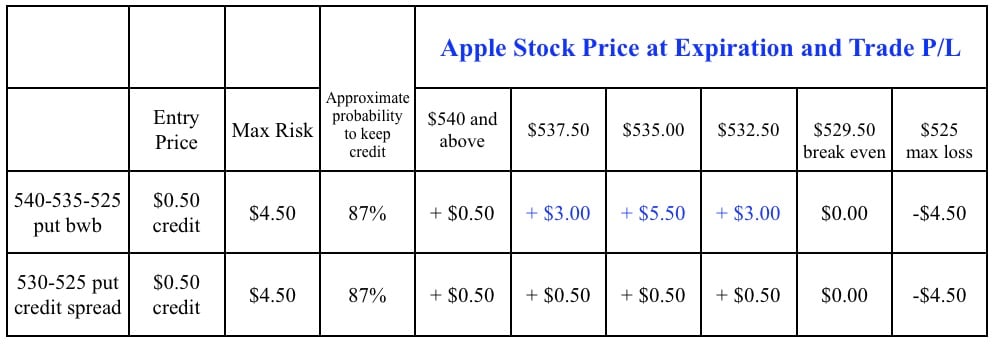
In this hypothetical example I’m looking at the weekly options that expire April 27, and earnings come out Tuesday the 24th after the close. If one thought that AAPL won’t drop 10% by next Friday, which would bring the stock down to $531 from the current price of $590 as I write this, then a high probability trade could be to sell the 530 puts and buy the 525 puts as a short put spread. The credit for this trade is currently about 50 cents so the risk would be $4.50 per share ($450 of risk per spread). If AAPL is above $530 next Friday, then that spread would expire worthless and the 50-cent credit would represent an 11% profit ($50 profit per spread).
Not bad. But if one could take the same risk, have the same break even point, and have the same approximate probability of keeping the full credit, and yet have the potential to make as much as $500 more per spread, then wouldn’t that be an interesting trade to consider? Welcome to just another use of the broken wing butterfly.
Using the same expiration options, the 540-535-525 put broken wing butterfly is currently trading for a 50-cent credit. This hypothetical trade risks the same as the credit spread, has the same break even point, the same approximate probability (as measured by the delta of the 530 put), but the big difference is that this trade has the built-in potential to make far more than just the entry credit.
Of course, the chances aren’t great for having AAPL trade below $540 and above $530 within the next week, but keep in mind that theoretically the stock does NOT necessarily have to trade below $540 for this trade to profit more than the 50-cent credit; depending on time, it might only have to move towards the 540 strike. Just moving the stock toward the butterfly can be enough to generate a profit – something I cover in the Broken Wing Butterfly video series.
What’s the downside? More commissions, so one would have to consider if the additional minimal cost of commissions justify the chance to potentially make much more than the credit of the put spread.
Trade safe!
Greg Loehr
Optionsbuzz.com
Please note: Hypothetical computer simulated performance results are believed to be accurately presented. However, they are not guaranteed as to accuracy or completeness and are subject to change without any notice. Hypothetical or simulated performance results have certain inherent limitations. Unlike an actual performance record, simulated results do not represent actual trading. Since, also, the trades have not actually been executed; the results may have been under or over compensated for the impact, if any, of certain market factors such as liquidity, slippage and commisions. Simulated trading programs in general are also subject to the fact that they are designed with the benefit of hindsight. No representation is being made that any portfolio will, or is likely to achieve profits or losses similar to those shown. All investments and trades carry risks.
No relevant positions.


One Comment on “A Different Look at AAPL Credit Spreads”
would be interested in how you adjust this position if it looks to be a max loss, thanks