Just wanted to write a short follow-up to the RIMM post. Many times a stock that has a good move off of earnings will have some predictable moves the following day as well. I want to share my longer-term perspective on RIMM as well as the actual trades I made yesterday. I think you will start to see that I am simply making the same simple trades over and over again…
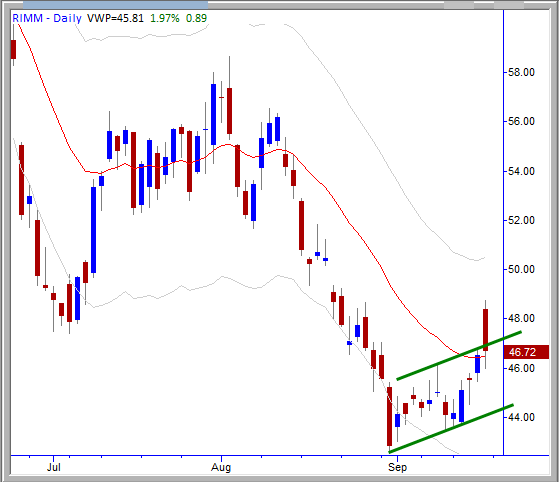
First, my thesis is that the current market structure in RIMM is a bear flag on the daily chart, which targets at least a retest of the 42.23 late August low. Perhaps there is another leg down beyond that, but I think the retest is an extremely high probability (~60%) play. After seeing the failure Friday, I put on some put spreads as a longer term position. On of the classic ways bear flags fail is they simply break to the upside, and I am viewing Friday’s action as a failed attempt at a failed bear flag(!). This is a legitimate concept, because these kinds of failures can trap more people than you might think. Anyway, I came in yesterday clearly expecting more downside.
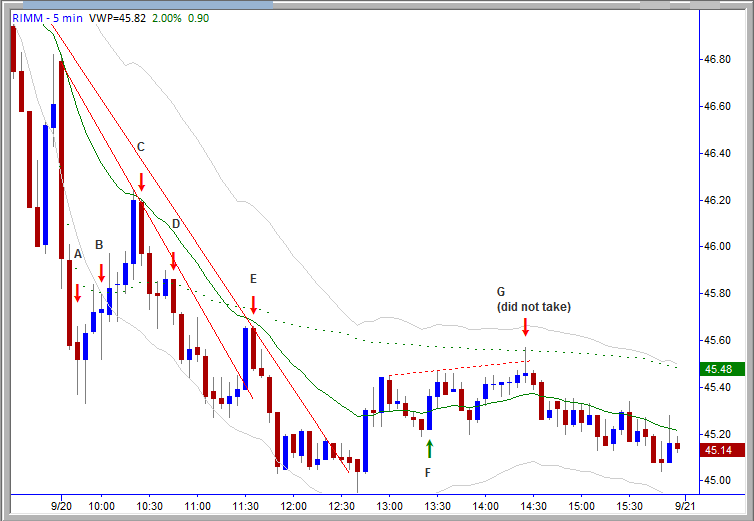
These were my actual trade entries. There are a few questionable trades there, and a few model trades. Let me share my thought process behind each one:
A- I thought there was a tiny chance RIMM would simply melt and go to zero that day. 🙂 I was very aggressive playing downside momentum, but I knew there was good chance I would be trapped. Actually, I knew this was extremely low probability play (I guessed way under 20%), but also thought the potential risk / reward justified it. There is also something to be said for executing in a stock you are watching just to get a good feel. I traded this very small, covered some at a small profit and scratched the rest.
B- I still think good chance we will melt, so I am very aggressive trading the first pullback. You can’t see on this chart, but this was a break out of a 1 minute bear flag that touched VWAP. I knew it was a good trade, but also the market is overextended at this point so I did it on small size. I took a medium sized (~.25) loss on a small position here. No prob.
C- This is the first real trade on the chart. Just like other trades I have mentioned on the blog: pulls back to the area of the moving average (no magic to moving average but good reference) and momentum shifts to the downside. This is the best possible trade on the entire chart for the day and I was lucky enough to do it on decent size.
D – Also a good trade. Think about this: You had a good entry on a large bear flag at C, so now you have the high probability (~66%) edge of that pattern at least trading to LOD (low of day). Then you have a pause in the move, so this is a logical entry for a smaller position. This is EXTREMELY valuable technical pattern: using higher timeframe as backdrop for smaller trade.
E- The mark on the chart is one bar early. I covered most of my position at the LOD but reshorted some here. I thought the previous bull bar was overdone.
F- Ok. So we have a consolidation at the low and a failed attempt to make a new leg down, followed by a sharp pop off the lows. Multiple trendlines have been broken so I start looking for a long scalp. I buy this bar as it breaks over the previous bar’s high, with a target of 45.65 (didn’t quite get there). This is a tricky trade, but a good one. I would suggest most traders should probably stick with shorts, but you need to know this trade is there so you do not look at shorts now. best to stand aside.
G- I had moved to to tunnel-vision on the market at this point and wasn’t really interested in trading RIMM. Still, this is an A+++ trade: 3 pushes up from the failed test of the lows that generated the (F) trade fulfills the expectation of that pattern. Attempt at lifting a trend channel line (dotted line) and test of VWAP. Should have been good for a test of LOD, but fell slightly short.
As you can see… the same stuff over and over. These are easy, consistent trades but they require a pretty good understanding of a lot of subtle factors, and as always, risk management is key.
I tweeted most of these entries during the day. I’ll try to keep the Twitter stream going, so follow me there AdamG_SMB


3 Comments on “RIMM – follow up post-earnings”
If you are trading the same easy patterns over and over, what do you think are some factors that make an inconsistent trader unable to do these things.
one of my fav posts by you btw.
Thanks Eric,
I think one big problem is patience. Looking at my day today I decided to not trade before FOMC (that might have been a mistake for some traders, but it was the right call for me), then I caught a couple really great trades after the announcement… and then tried to force a few trades and ended the day slightly down.
Double frustrating since my bias was long, I made money long, and then switched to short at the right time and still managed to lose.
For me, it usually comes down to forcing trades which is what I did here. It’s a very different psychology… for me it feels like sometimes I “let the trades come to me” which nearly always works out well and then when I go looking for trades I’m kind of 50/50. (I know this is my mental definition of what it feels like when I am in the Zone as I was with RIMM those two days.)
There’s also the fact that, even with the best technical analysis and execution skills, trading is HARD. Any small mistake is punished relentlessly… there is a very fine edge between making money and not. Make sense?
I went MAX share size at RIMM 48.80 today (9/22) @ 10:34am which led to some unidentifiable technical reason that made it go to 49.10. This move made me wanna jab a fork in my eye or quit trading. Either was acceptable at the time.