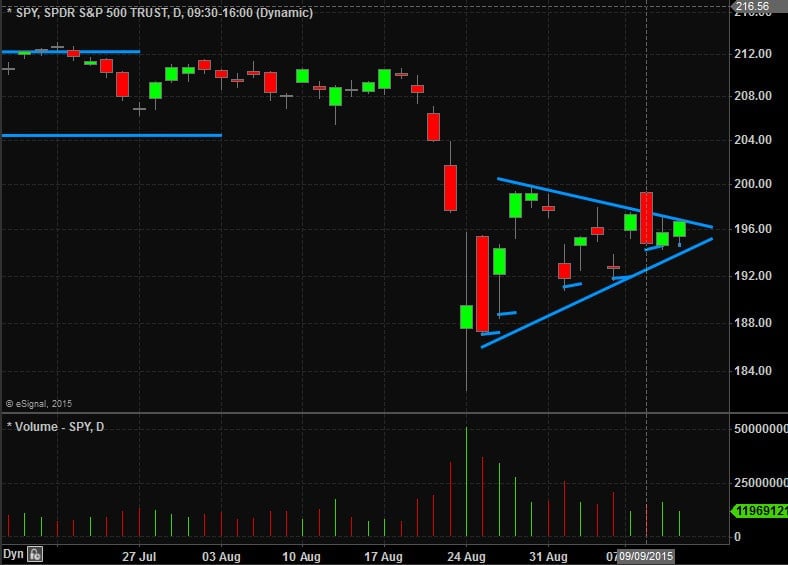
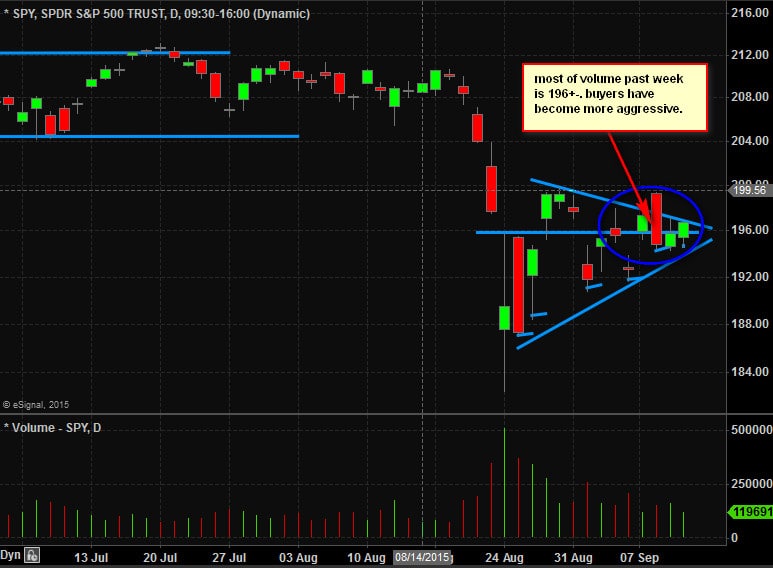
This weekend I have seen a few versions of this daily chart of the SPY drawn with two lines to offer what appears to be “symmetrical triangle”. The idea is that buyers/sellers are becoming more aggressive and when one group wins the SPY will close above/below one of the two lines leading to an explosive move. I’m not a huge fan of the visual as there aren’t really many “clean points” to draw against daily closing prices. In fact, if you did use closing prices the pattern would have already resolved itself to the upside. But there is one thing you can do with this pattern that is instructive and I demonstrate with the second image below.
I draw a horizontal line where the two sides of the “triangle” are coming together. What this does visually is show how much of the volume has shifted towards the top of the range in recent trading days. This is indicative of buyers becoming more aggressive. I’ve tweeted some 30 minute charts that shows this as well. The goal of understanding price action is to help us formulate an idea of whether buyers or sellers are in control of a particular market and when that control may accelerate or reverse. By doing so we can tip the probabilities and risk/reward in our favor for a particular trade.
Based on the lows of August and the high that followed a few days later more balance between buyers/sellers would be indicated if the SPY were spending more time between 192-194 which it has not done the past few trading days. This is not to say that sellers cannot retake control early next week but as of right now the odds favor a re-test of recent highs…

Steven Spencer is the co-founder of SMB Capital and SMB University which provides trading education in stocks, options, forex and futures. He has traded professionally for 19 years. His email address is: [email protected].

*no relevant positions


