There are so many indicators one can use for technical analysis. If you spend some time with experienced traders many will tell you they use very few indicators to none. Hmm. The new and developing trader would be surprised at how clean most charts look for many successful traders. Steve uses very few indicators. Adam is a huge proponent of the clean chart. GMan has too many screens to look at to have many complicated indicators in his visage. I use volume, price and psychology.
I mostly trade with the trend. I mostly trade with the intraday trend. When I punch up my charts I am most concerned with the psychology of the stock. More specifically how far away is the stock from important psychological levels. And where can I enter to follow the psychology of most players.
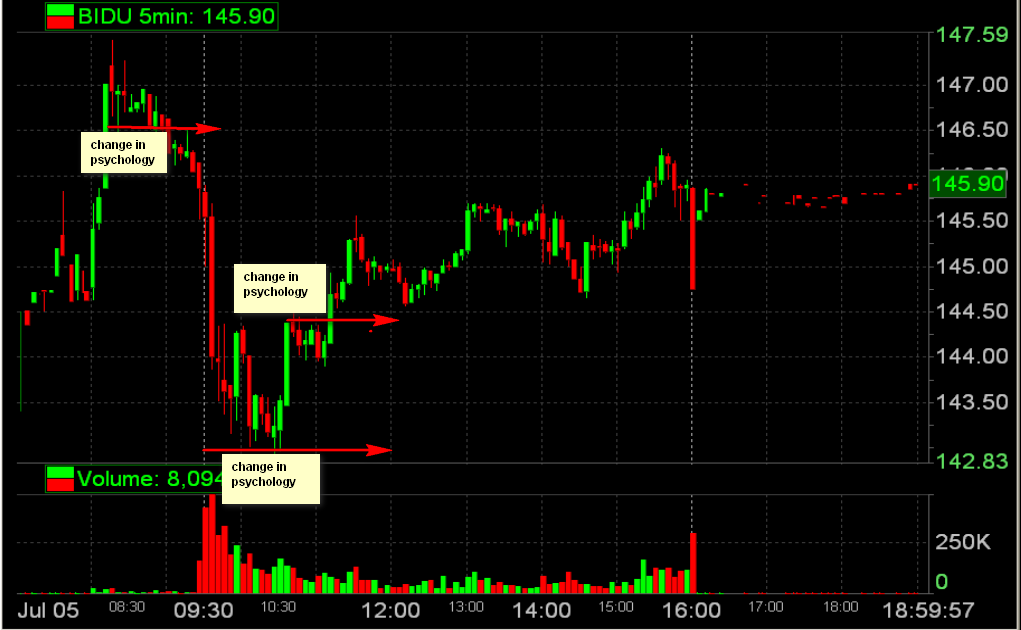
Let’s take a recent trading session in BIDU to explain. 146.50 was an important psychological level in the premarket. Above this level and most traders were thinking gap and go higher. Below this level and now a new thought would enter the minds of more traders. Maybe BIDU is gonna gap and fail. Below 146.50 introduced a new psychology for BIDU and thus this became an important technical level for me.
Below the gap fill at 143.25ish traders were thinking mostly that BIDU was weak. A move below and you add to your shorts and play for a move to 140ish. The psychology is all things weak and trending lower. But at 143 a stubborn buyer refused to drop. And BIDU spiked and reversed. The next day we used this level as support for a solid 3.5 upmove to 146.50. Why was this 143 level so important? Because this price changed the psychology of BIDU during this important intraday. There was nothing but down until this price which reversed the momentum of the stock to a strong close.
Above 144.40 introduced another example of a change in psychology. BIDU bounced from the gap fill a few times to this area but failed and headed lower. This was an area to short some more for those following the intraday trend. And most players saw no evidence that BIDU was only trading lower with this overhead resistance in place. But then finally there was a push above this resistance. And a new psychology was introduced to BIDU. Now BIDU was no only trading lower. Now more started thinking: perhaps the move to 143 was just a small pullback in a very strong stock of late and we now need to go find at least 146.50. The psychology changed.
When I look at charts I look for spots where the psychology changed. To me these are the most important technical levels. Perhaps you can use this thought in your own trading to find better trading levels for you.
Mike Bellafiore
Author, One Good Trade


2 Comments on “Where the Psychology Changed”
I reaaly like that thought process. I like to imagine important support /resisatance levels as battles …eventually one side wins and has to withdray its troops and yield terrain.
When I started trading I had Nine trend lines MACD and Stochastic. My only references now is MACD and price action, and I lean on price action as if it were crutches. I love a clean start but starting out, I was looking for the key to success and I thought it was in the all those wavy lines.