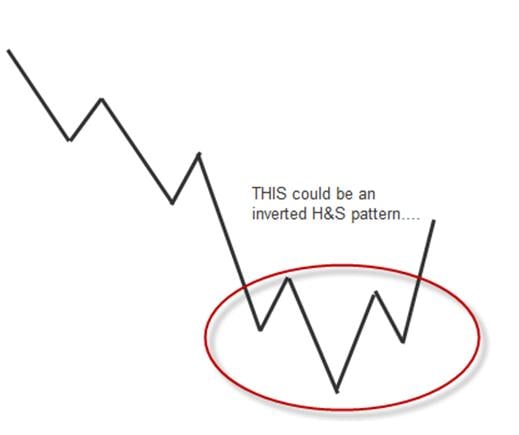
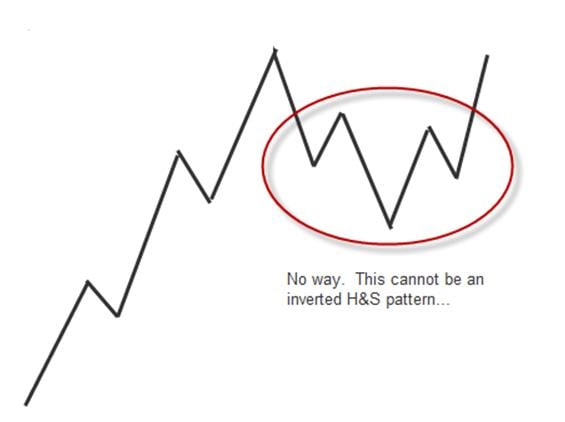
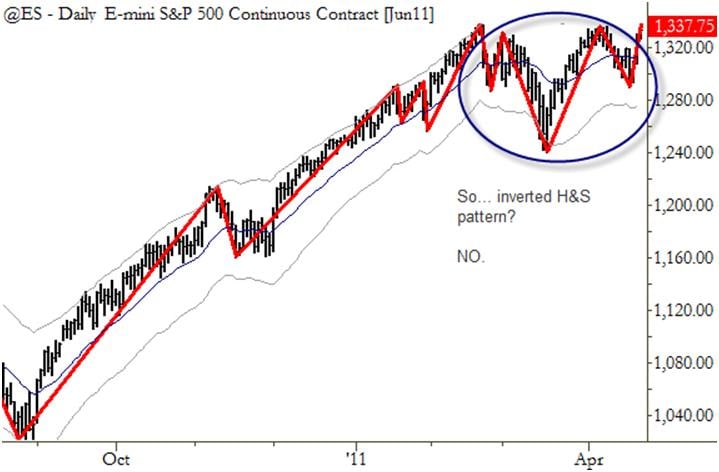
Ok, after the 13th person in a week and a half asked if it I thought this could be an inverted head and shoulders pattern in the S&P 500, I decided I had to write a quick post.
First of all, let me start off by saying that this is one of my least favorite patterns. I would never take a trade because of a head and shoulders pattern. I never look for them on charts, and, in fact, the only reason I ever know they are there is when someone points one out. I think it is one of the most common patterns in the media and in the public perception, because it is easy to draw on the chart and to tell people what it is. It makes a good soundbite, but the media does not understand an important nuance of this pattern. You must understand this if you’re going to trade this pattern.
If is clear if we go back to the source material like Edwards and Magee (or the source material for the source material: Schabacker’s Technical Analysis and Stock Market Profits(1932)) that a head and shoulders is a large scale topping formation. Conversely, an inverted head and shoulders is a large scale bottoming formation. You DO NOT have these patterns in the middle of a trend. You do not have inverted head and shoulders near the top of an extended trend as we have had off the 2009 lows. We also had the same issue with this pattern during the financial crisis, when every day the major media seemed to roll out a new “Chartologist” who kept pointing out heads and shoulders on the way down. This is a serious misunderstanding of this pattern. Context matters: you can only have a head and shoulders (top) after an extended uptrend, and you can only have a head and shoulders bottom (inverted head and shoulders) after an extended decline. You can have other patterns that have the same shape, but both the shape and the context are equally important.
There is a lot more to technical analysis in general, and even to trading simple chart patterns, than just recognizing patterns of bars and shapes on charts. As I have argued, these patterns occur on random data, and, taken by themselves, they are absolutely meaningless. You must put them in context. You must understand market structure. You must understand the buying and selling imbalance that created the pattern… this is far more important than the pattern itself… they are the reality behind the pattern. We don’t trade patterns, we trade the underlying imbalance that created it.
And, if you ARE going to trade patterns, I think you owe it to yourself to read the source material and really understand them. Be concise and accurate in your thinking and don’t be misled by facile interpretations of patterns.


So, no, it’s not an inverted head and shoulders pattern… J


11 Comments on “Is this an inverted Head and Shoulders pattern on the S&P?”
Very clear. Had never seen anyone mention this..including “knowlegeable” chartists.
said this about 5 times on the Stocktwits SPY board. An inverted H&S comes at the end of a downtrend, not at the top of an uptrend. Comment was ignored as bullmarket geniuses see what they want to see.
Good post.
Much respect but would have to disagree. Edwards & Magee spoke about H&S in the context of dow theory and trends and as primary tops/bottoms, yes. But the first half of every H&S is a trend. In talking about an inverted H&S, they focused on volume and price action to show what is happening. Exactly as what is happening here, there is heavy selling into the left shoulder and head, and the selling tapers off into the right shoulder. A break of the neckline on volume would indicate a bottom for this reaction. They gave examples of 2 month inverted H&S patterns that were reactions and when looked on from the scope of a monthly chart, would still have been in an uptrend. The key is what is price/volume action saying, and here it says selling is tapering off to cause a right shoulder, and a breakout on volume would signify an end to this reaction. I agree that H&S are going to be most effective as primary tops and bottoms, however, because it’s not at the end of one does not mean it’s not that pattern. Apologies for being long winded.
good point here, but if the “money” that moves the market “views” this as an inverted H&S and momentum follows (above the neckline) then this will morph into the self-fullfilling prophecy as do most chart patterns. not to mention there is an obvious resistance area at 33’ish — any break above will push this to the measured move to 1350/60 (and maybe beyond).
Ahhh, why did you enlighten the masses? I was taking their money. 🙂
Hopefully your book will go into more detail about imbalance causation.
1. Heads and Shoulders are the first patterns in the section called “Reversal Patterns” in Edwards and Magee. This current formation in the S&P is a continuation pattern, which a H&S is not. This is a profoundly important point.
2. Edwards and Magee begin their explanation of H&S bottom by saying it follows “a decline, climaxing a more or less extensive downtrend…”
it’s a reversal pattern… that’s the bottom line. The market may well head higher here… I’m probably more bullish than most people and have been publicly for many months… but it is important to be precise in our thinking. Labels matter. Otherwise, why have them at all?
Have a good weekend
Adam, with all due respect, I have to disagree also because specifically on page 181-183 of Edwards and Magee’s Technical Analysis of Stock Trends they talk of head and shoulders patterns forming as continuation patterns, complete with chart examples. The only concern they have about the pattern is that the traditional measured move out of the pattern isn’t as reliable. Sometimes the stock falls short of the objective and sometimes it exceeds it by a significant amount.
Of course Nat is right. Have tons of respect for you, Adam, but especially since you’re writing a book, if you’re going to discuss classic TA (which I know is not your thing), please get it right. Head and shoulders continuation patterns are well known in uptrends and downtrends as per Edwards and Magee and others, such as John J. Murphy (cf., Technical Analysis of the Financial Markets, pp 153-155).
hey guys,
you’re not wrong with this… there are sections on those books treating H&S as continuation patterns, but this is definitely a subordinate interpretation of the pattern. it is far better used as a reversal pattern. the fact is, you can basically take pretty much any market pattern and find some variation of a H&S pattern in it if highs and lows are uneven!
to some extend it’s really just a semantic argument, but in my experience we’re much better off focusing on what the developing patterns tell us about buying and selling pressure than the patterns themselves. i’ll try to write more on this in the near future.
J.C. Parets: Inverted Head & Shoulder.
http://finance.yahoo.com/blogs/breakout/don-t-sell-silver-yet-uptrend-intact-chartist-150216010.html